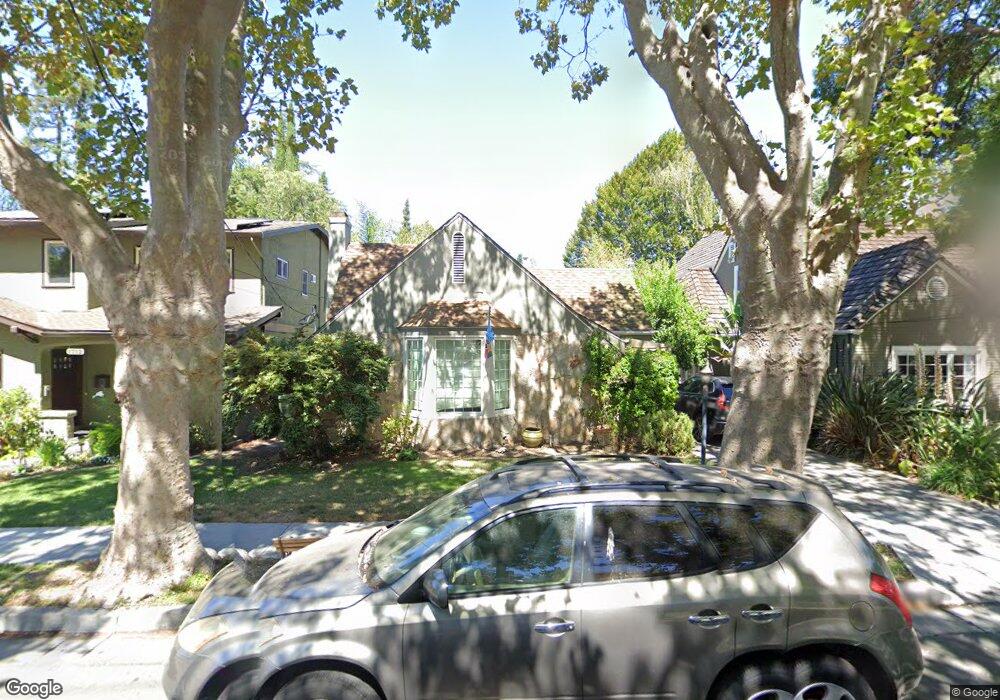
1718 Glen Una Ave San Jose, CA 95125
Willow Glen NeighborhoodEstimated Value: $1,446,142 - $2,001,000
About This Home
This home is located at 1718 Glen Una Ave, San Jose, CA 95125 and is currently estimated at $1,680,536, approximately $1,306 per square foot. 1718 Glen Una Ave is a home located in Santa Clara County with nearby schools including Booksin Elementary, Willow Glen Middle, and Willow Glen High School.
Ownership History
We collect this data history from publicly available records. To have your information removed, we recommend requesting removal directly through your county’s website.
Purchase Details
Home Financials for this Owner
Home Financials are based on the most recent Mortgage that was taken out on this home.Purchase Details
Purchase Details
Home Financials for this Owner
Home Financials are based on the most recent Mortgage that was taken out on this home.Purchase Details
Purchase Details
Home Values in the Area
Average Home Value in this Area
Purchase History
We collect this data history from publicly available records. To have your information removed, we recommend requesting removal directly through your county’s website.
| Date | Buyer | Sale Price | Title Company |
|---|---|---|---|
| -- | Pacific Coast Title | ||
| -- | None Available | ||
| -- | Fidelity National Title Co | ||
| -- | -- | ||
| -- | -- |
Mortgage History
We collect this data history from publicly available records. To have your information removed, we recommend requesting removal directly through your county’s website.
| Date | Status | Borrower | Loan Amount |
|---|---|---|---|
| Previous Owner | $412,000 | ||
| Previous Owner | $225,000 |
Tax History
We collect this data history from publicly available records. To have your information removed, we recommend requesting removal directly through your county’s website.
| Year | Tax Paid | Tax Assessment Tax Assessment Total Assessment is a certain percentage of the fair market value that is determined by local assessors to be the total taxable value of land and additions on the property. | Land | Improvement |
|---|---|---|---|---|
| 2025 | $2,367 | $61,617 | $21,451 | $40,166 |
| 2024 | $2,367 | $60,410 | $21,031 | $39,379 |
| 2023 | $2,276 | $59,226 | $20,619 | $38,607 |
| 2022 | $2,245 | $58,065 | $20,215 | $37,850 |
| 2021 | $2,136 | $56,927 | $19,819 | $37,108 |
| 2020 | $2,039 | $56,344 | $19,616 | $36,728 |
| 2019 | $1,967 | $55,240 | $19,232 | $36,008 |
| 2018 | $1,921 | $54,157 | $18,855 | $35,302 |
| 2017 | $1,890 | $53,096 | $18,486 | $34,610 |
| 2016 | $1,758 | $52,056 | $18,124 | $33,932 |
| 2015 | $1,645 | $51,275 | $17,852 | $33,423 |
| 2014 | $1,176 | $50,272 | $17,503 | $32,769 |
Map
- 1793 Harmil Way
- 1866 Glen Una Ave
- 1835 Ellen Ave
- 1693 Lincoln Ave
- 1823 Lincoln Ave
- 919 Willow Glen Way
- 1123 Dean Ave
- 1127 Norval Way
- 2991- 2987 Almaden Rd
- 1538 Lincoln Ave
- 1975 Lincoln Ave
- 1791 Kirkland Ave
- 944 Malone Rd
- 1130 Nevada Ave
- 1973 Bird Ave
- 1490 Curtiss Ave
- 1773 Creek Dr
- 964 Minnesota Ave
- 1484 Bird Ave
- 785 Malone Rd
- 1712 Glen Una Ave
- 1724 Glen Una Ave
- 1730 Glen Una Ave
- 1719 Harmil Way
- 1725 Harmil Way
- 992 Pine Ave
- 996 Pine Ave
- 1713 Harmil Way
- 1736 Glen Una Ave
- 1733 Harmil Way
- 1725 Glen Una Ave
- 1705 Harmil Way
- 1713 Glen Una Ave
- 1731 Glen Una Ave
- 1741 Harmil Way
- 1742 Glen Una Ave
- 1006 Pine Ave
- 1737 Glen Una Ave
- 1743 Glen Una Ave
- 1745 Harmil Way
Ask me questions while you tour the home.