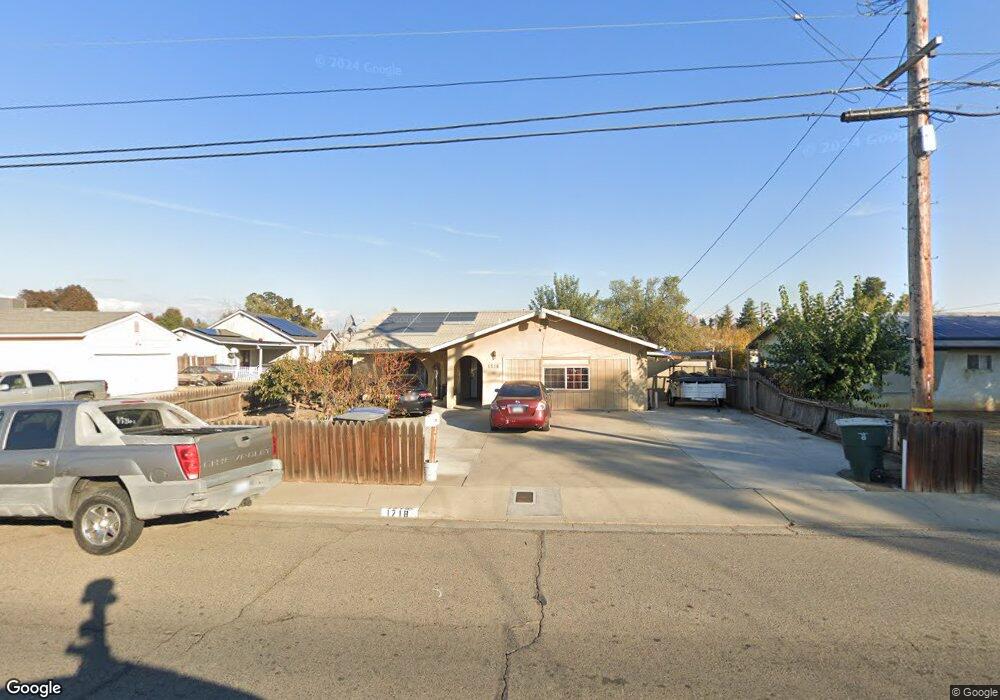
1718 N Bridge St Visalia, CA 93291
North Visalia NeighborhoodEstimated Value: $216,000 - $269,000
3
Beds
2
Baths
1,181
Sq Ft
$213/Sq Ft
Est. Value
About This Home
This home is located at 1718 N Bridge St, Visalia, CA 93291 and is currently estimated at $251,528, approximately $212 per square foot. 1718 N Bridge St is a home located in Tulare County with nearby schools including Crowley Elementary School, Divisadero Middle School, and Mt. Whitney High School.
Ownership History
Date
Name
Owned For
Owner Type
Purchase Details
Closed on
Mar 16, 2016
Sold by
Guadarrama Alberto Diaz
Bought by
Guadarrama Maria Isabel and Guadarrama Oscar
Current Estimated Value
Purchase Details
Closed on
Oct 7, 2011
Sold by
Rodriguez Marco A
Bought by
Guadarrama Alberto Diaz and Guadarrama Maria Isabel
Home Financials for this Owner
Home Financials are based on the most recent Mortgage that was taken out on this home.
Original Mortgage
$73,098
Outstanding Balance
$50,807
Interest Rate
4.5%
Mortgage Type
FHA
Estimated Equity
$200,721
Purchase Details
Closed on
May 12, 2011
Sold by
Wells Fargo Bank Na
Bought by
Rodriguez Marco A and Rodriguez Alma S
Purchase Details
Closed on
Sep 14, 2010
Sold by
Gaitan Irmalinda
Bought by
Wells Fargo Bank Na
Purchase Details
Closed on
Jun 7, 1994
Sold by
Contreras Christina
Bought by
Gaitan Irmalinda
Home Financials for this Owner
Home Financials are based on the most recent Mortgage that was taken out on this home.
Original Mortgage
$45,500
Interest Rate
8.99%
Create a Home Valuation Report for This Property
The Home Valuation Report is an in-depth analysis detailing your home's value as well as a comparison with similar homes in the area
Home Values in the Area
Average Home Value in this Area
Purchase History
| Date | Buyer | Sale Price | Title Company |
|---|---|---|---|
| Guadarrama Maria Isabel | -- | None Available | |
| Guadarrama Alberto Diaz | $75,000 | Chicago Title Company | |
| Rodriguez Marco A | $50,000 | Chicago Title Company | |
| Wells Fargo Bank Na | $58,898 | Accommodation | |
| Gaitan Irmalinda | -- | Old Republic Title Company |
Source: Public Records
Mortgage History
| Date | Status | Borrower | Loan Amount |
|---|---|---|---|
| Open | Guadarrama Alberto Diaz | $73,098 | |
| Previous Owner | Gaitan Irmalinda | $45,500 |
Source: Public Records
Tax History Compared to Growth
Tax History
| Year | Tax Paid | Tax Assessment Tax Assessment Total Assessment is a certain percentage of the fair market value that is determined by local assessors to be the total taxable value of land and additions on the property. | Land | Improvement |
|---|---|---|---|---|
| 2025 | $927 | $94,201 | $25,119 | $69,082 |
| 2024 | $927 | $92,355 | $24,627 | $67,728 |
| 2023 | $900 | $90,545 | $24,145 | $66,400 |
| 2022 | $858 | $88,771 | $23,672 | $65,099 |
| 2021 | $858 | $87,031 | $23,208 | $63,823 |
| 2020 | $843 | $86,139 | $22,970 | $63,169 |
| 2019 | $825 | $84,450 | $22,520 | $61,930 |
| 2018 | $795 | $82,794 | $22,078 | $60,716 |
| 2017 | $793 | $81,170 | $21,645 | $59,525 |
| 2016 | $769 | $79,579 | $21,221 | $58,358 |
| 2015 | $770 | $78,383 | $20,902 | $57,481 |
| 2014 | $745 | $76,848 | $20,493 | $56,355 |
Source: Public Records
Map
Nearby Homes
- 1633 N Tipton St
- 203 E Harold Ct
- 339 NE 4th Ave
- 312 NE 4th Ave
- 841 E Prospect Ave
- 223 W Buena Vista Ave
- 1432 N Locust St
- 625 E Ferguson Ave
- 128 W Houston Ave
- 1540 N Encina St
- 636 E Roosevelt Ave
- 125 N Hicks St Unit A
- 1635 N Dinuba Blvd
- 2218 N Oakhurst St
- 2420 N Michael St
- 1145 E Ferguson Ave
- 2419 N Clark St
- 2241 N Edison St
- 1146 E Buena Vista Ave
- 2447 N Michael St
- 1704 N Bridge St
- 1734 N Bridge St
- 1720 N Bridge St
- 1732 N Bridge St
- 1742 N Bridge St
- 1730 N Bridge St
- 1748 N Bridge St
- 1702 N Bridge St
- 1719 N Bridge St
- 1733 N Bridge St
- 1724 N Bridge St
- 1711 N Bridge St
- 1649 N Bridge St
- 1726 N Bridge St
- 1737 N Bridge St
- 1741 N Bridge St
- 1643 N Bridge St
- 1804 N Bridge St
- 1801 N Bridge St
- 1638 N Bridge St