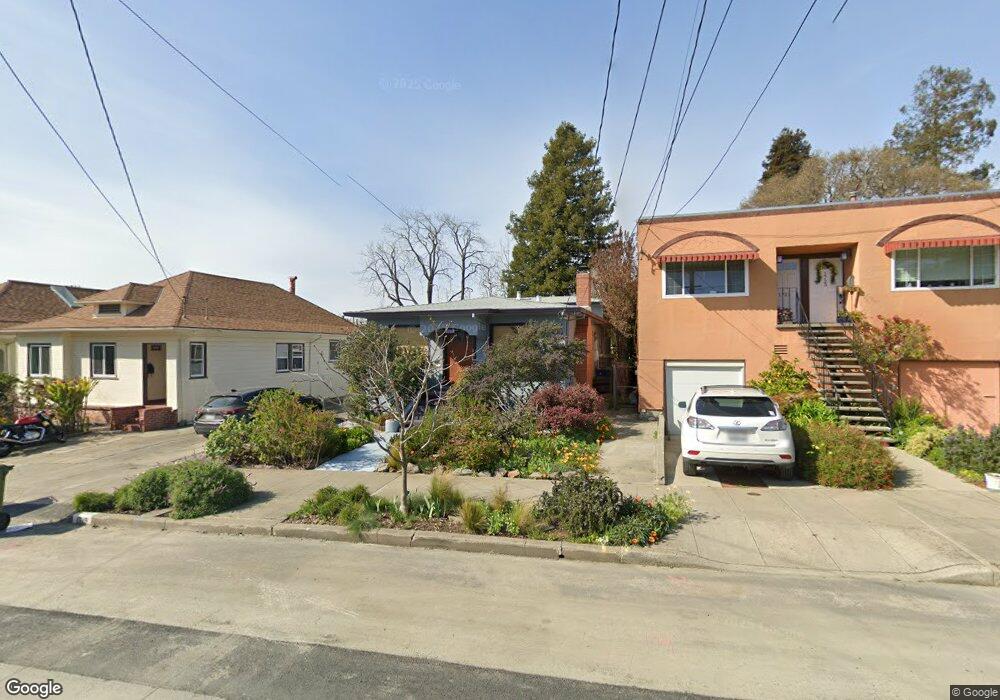
1719 Delaware St Berkeley, CA 94703
North Berkeley NeighborhoodEstimated Value: $1,360,000 - $1,756,000
2
Beds
1
Bath
2,160
Sq Ft
$763/Sq Ft
Est. Value
About This Home
This home is located at 1719 Delaware St, Berkeley, CA 94703 and is currently estimated at $1,649,087, approximately $763 per square foot. 1719 Delaware St is a home located in Alameda County with nearby schools including Berkeley Arts Magnet at Whittier School, Washington Elementary School, and Oxford Elementary School.
Ownership History
Date
Name
Owned For
Owner Type
Purchase Details
Closed on
Jan 25, 2006
Sold by
Herschman Jill and Rogers Christian
Bought by
Rogers Christian A and Herschman Jill
Current Estimated Value
Purchase Details
Closed on
Oct 4, 2000
Sold by
Acton Sidney E
Bought by
Herschman Jill and Rogers Christian
Home Financials for this Owner
Home Financials are based on the most recent Mortgage that was taken out on this home.
Original Mortgage
$356,800
Outstanding Balance
$128,539
Interest Rate
7.75%
Estimated Equity
$1,520,548
Purchase Details
Closed on
Jan 4, 1999
Sold by
Acton Sidney E
Bought by
Acton Sidney E and Acton 1994 Revocable Intervivo
Purchase Details
Closed on
Jun 6, 1994
Sold by
Acton Sidney E and Acton Phyllis C
Bought by
Acton Sidney E and Acton Phyllis C
Create a Home Valuation Report for This Property
The Home Valuation Report is an in-depth analysis detailing your home's value as well as a comparison with similar homes in the area
Home Values in the Area
Average Home Value in this Area
Purchase History
| Date | Buyer | Sale Price | Title Company |
|---|---|---|---|
| Rogers Christian A | -- | None Available | |
| Herschman Jill | $446,000 | Placer Title Company | |
| Acton Sidney E | -- | -- | |
| Acton Phyllis C | -- | -- | |
| Acton Sidney E | -- | -- |
Source: Public Records
Mortgage History
| Date | Status | Borrower | Loan Amount |
|---|---|---|---|
| Open | Herschman Jill | $356,800 |
Source: Public Records
Tax History
| Year | Tax Paid | Tax Assessment Tax Assessment Total Assessment is a certain percentage of the fair market value that is determined by local assessors to be the total taxable value of land and additions on the property. | Land | Improvement |
|---|---|---|---|---|
| 2025 | $11,668 | $665,001 | $201,600 | $470,401 |
| 2024 | $11,668 | $651,826 | $197,648 | $461,178 |
| 2023 | $11,406 | $645,910 | $193,773 | $452,137 |
| 2022 | $11,163 | $626,248 | $189,974 | $443,274 |
| 2021 | $11,165 | $613,831 | $186,249 | $434,582 |
| 2020 | $10,477 | $614,467 | $184,340 | $430,127 |
| 2019 | $9,968 | $602,420 | $180,726 | $421,694 |
| 2018 | $9,777 | $590,610 | $177,183 | $413,427 |
| 2017 | $9,426 | $579,032 | $173,709 | $405,323 |
| 2016 | $9,059 | $567,681 | $170,304 | $397,377 |
| 2015 | $8,927 | $559,158 | $167,747 | $391,411 |
| 2014 | $8,790 | $548,208 | $164,462 | $383,746 |
Source: Public Records
Map
Nearby Homes
- 1808 Cedar St
- 1625 Martin Luther King jr Way
- 1813 Sacramento St
- 1436 Delaware St
- 2218 -2222 Grant St
- 1609 Bonita Ave Unit 5
- 2015 Delaware St
- 2015 Delaware St Unit A
- 1564 Sacramento St
- 1610 Milvia St
- 2118 California St
- 1815 Vine St
- 1411 Hearst Ave Unit 2
- 1425 Martin Luther King jr Way
- 1368 Rose St
- 1529 Ada St
- 1322 Virginia St
- 1682 Oxford St
- 2201 Virginia St Unit 2
- 1261 Hearst Ave
- 1717 Delaware St
- 1723 Delaware St
- 1721 Delaware St
- 1715 Delaware St
- 1727 Delaware St
- 1709 Delaware St
- 1731 Delaware St
- 1712 Francisco St
- 1714 Francisco St
- 1708 Francisco St
- 1710 Francisco St
- 1716 Francisco St
- 1705 Delaware St
- 1706 Francisco St
- 1735 Delaware St
- 1724 Francisco St
- 1743 McGee Ave
- 1739 McGee Ave
- 1726 Francisco St
- 1704 Francisco St Unit 1704 Francisco A
Your Personal Tour Guide
Ask me questions while you tour the home.