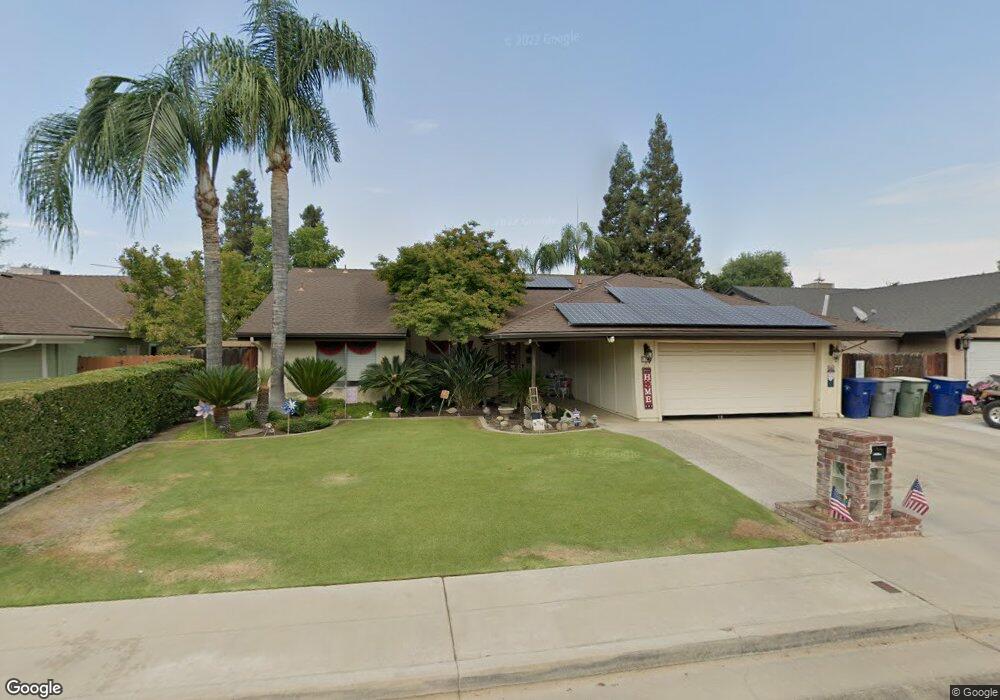
1719 Escalon Ave Clovis, CA 93611
Estimated Value: $375,000 - $424,000
4
Beds
2
Baths
1,810
Sq Ft
$222/Sq Ft
Est. Value
About This Home
This home is located at 1719 Escalon Ave, Clovis, CA 93611 and is currently estimated at $402,331, approximately $222 per square foot. 1719 Escalon Ave is a home located in Fresno County with nearby schools including Cox Elementary School, Clark Intermediate School, and Clovis High School.
Ownership History
Date
Name
Owned For
Owner Type
Purchase Details
Closed on
Apr 24, 2002
Sold by
Crocker Betty A
Bought by
Gardner Scott E
Current Estimated Value
Home Financials for this Owner
Home Financials are based on the most recent Mortgage that was taken out on this home.
Original Mortgage
$126,308
Interest Rate
6.66%
Mortgage Type
FHA
Purchase Details
Closed on
Jan 9, 1996
Sold by
Crocker Alan G
Bought by
Crocker Betty A
Home Financials for this Owner
Home Financials are based on the most recent Mortgage that was taken out on this home.
Original Mortgage
$108,845
Interest Rate
7.38%
Mortgage Type
FHA
Purchase Details
Closed on
Nov 28, 1995
Sold by
Everett Russell J and Everett Christina J
Bought by
Gardner Scott E and Crocker Betty A
Home Financials for this Owner
Home Financials are based on the most recent Mortgage that was taken out on this home.
Original Mortgage
$108,845
Interest Rate
7.38%
Mortgage Type
FHA
Create a Home Valuation Report for This Property
The Home Valuation Report is an in-depth analysis detailing your home's value as well as a comparison with similar homes in the area
Home Values in the Area
Average Home Value in this Area
Purchase History
| Date | Buyer | Sale Price | Title Company |
|---|---|---|---|
| Gardner Scott E | -- | Chicago Title Co | |
| Crocker Betty A | -- | Central Title Company | |
| Gardner Scott E | $109,500 | Central Title Company |
Source: Public Records
Mortgage History
| Date | Status | Borrower | Loan Amount |
|---|---|---|---|
| Closed | Gardner Scott E | $126,308 | |
| Previous Owner | Gardner Scott E | $108,845 |
Source: Public Records
Tax History
| Year | Tax Paid | Tax Assessment Tax Assessment Total Assessment is a certain percentage of the fair market value that is determined by local assessors to be the total taxable value of land and additions on the property. | Land | Improvement |
|---|---|---|---|---|
| 2025 | $2,222 | $194,336 | $50,015 | $144,321 |
| 2023 | $2,178 | $186,792 | $48,074 | $138,718 |
| 2022 | $2,106 | $183,131 | $47,132 | $135,999 |
| 2021 | $2,045 | $179,541 | $46,208 | $133,333 |
| 2020 | $2,037 | $177,701 | $45,735 | $131,966 |
| 2019 | $1,996 | $174,218 | $44,839 | $129,379 |
| 2018 | $1,951 | $170,803 | $43,960 | $126,843 |
| 2017 | $1,916 | $167,455 | $43,099 | $124,356 |
| 2016 | $1,850 | $164,172 | $42,254 | $121,918 |
| 2015 | $1,820 | $161,707 | $41,620 | $120,087 |
| 2014 | $1,786 | $158,540 | $40,805 | $117,735 |
Source: Public Records
Map
Nearby Homes
- 1498 Escalon Ave
- 1855 Vartikian Ave
- 96 Burgan Ave
- 22 N Bliss Ave
- 1946 Calimyrna Ave
- 860 Mcarthur Ave
- 2051 Sierra Ave
- 2043 Escalon Ave
- 1272 Bullard Ave
- 2047 Menlo Ave
- 911 Stanford Ave
- 760 Sunnyside Ave
- 2051 Los Altos Ave
- 2216 Ellery Ave
- 2231 Escalon Ave
- 2034 Wrenwood Ave
- 1606 Barstow Ave
- 1228 Jefferson Ave
- 367 N Raphael Ln Unit 367
- 2089 Boccioni Ln
- 1727 Escalon Ave
- 1711 Escalon Ave
- 1694 Tollhouse Ln
- 1690 Tollhouse Ln
- 1664 Tollhouse Ln
- 1735 Escalon Ave
- 1696 Tollhouse Ln
- 351 Bundy Ave
- 316 Renn Ave
- 1698 Tollhouse Ln
- 1703 Escalon Ave
- 1662 Tollhouse Ln
- 1743 Escalon Ave
- 322 Bundy Ave
- 371 Bundy Ave
- 336 Renn Ave
- 1736 Tollhouse Ln
- 342 Bundy Ave
- 1638 Tollhouse Ln
- 1738 Tollhouse Ln
Your Personal Tour Guide
Ask me questions while you tour the home.