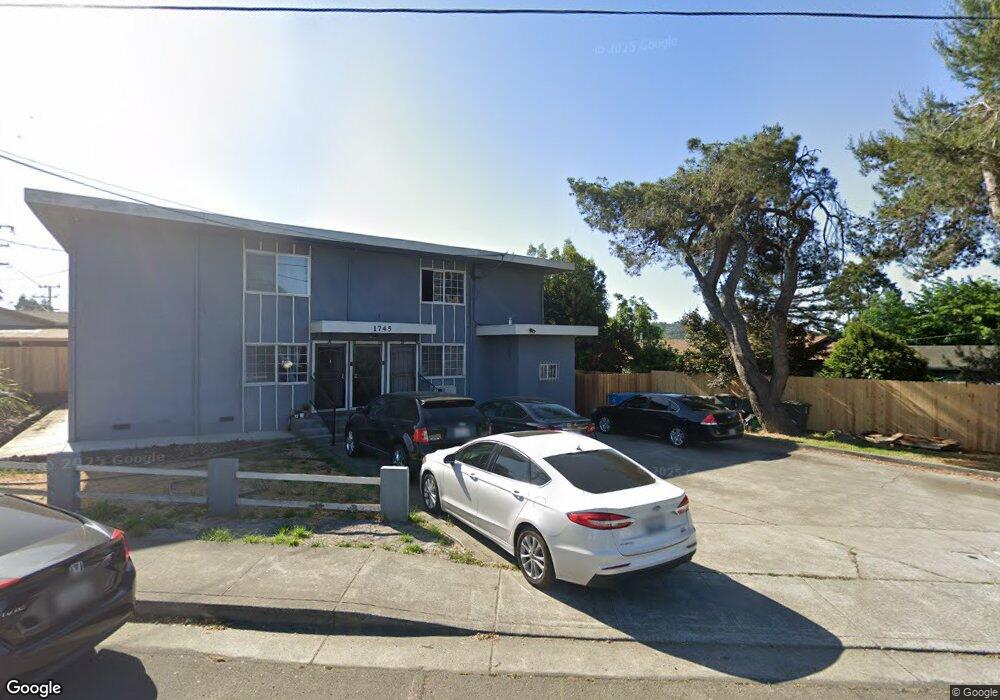
1719 Lemon St Vallejo, CA 94590
West Vallejo NeighborhoodEstimated Value: $354,000 - $435,000
2
Beds
1
Bath
760
Sq Ft
$503/Sq Ft
Est. Value
About This Home
This home is located at 1719 Lemon St, Vallejo, CA 94590 and is currently estimated at $382,645, approximately $503 per square foot. 1719 Lemon St is a home located in Solano County with nearby schools including Grace Patterson Elementary School, Vallejo High School, and St. Basil Catholic School.
Ownership History
Date
Name
Owned For
Owner Type
Purchase Details
Closed on
Jul 15, 2004
Sold by
Bito Araceli Lynn
Bought by
Bito George M
Current Estimated Value
Home Financials for this Owner
Home Financials are based on the most recent Mortgage that was taken out on this home.
Original Mortgage
$130,000
Interest Rate
6.27%
Mortgage Type
New Conventional
Purchase Details
Closed on
Apr 16, 2002
Sold by
Bito George M and Bito Cecila J
Bought by
Bito George M
Home Financials for this Owner
Home Financials are based on the most recent Mortgage that was taken out on this home.
Original Mortgage
$64,000
Interest Rate
6.62%
Create a Home Valuation Report for This Property
The Home Valuation Report is an in-depth analysis detailing your home's value as well as a comparison with similar homes in the area
Home Values in the Area
Average Home Value in this Area
Purchase History
| Date | Buyer | Sale Price | Title Company |
|---|---|---|---|
| Bito George M | -- | Chicago Title Co | |
| Bito George M | -- | Fidelity National Title Co |
Source: Public Records
Mortgage History
| Date | Status | Borrower | Loan Amount |
|---|---|---|---|
| Closed | Bito George M | $130,000 | |
| Closed | Bito George M | $64,000 |
Source: Public Records
Tax History Compared to Growth
Tax History
| Year | Tax Paid | Tax Assessment Tax Assessment Total Assessment is a certain percentage of the fair market value that is determined by local assessors to be the total taxable value of land and additions on the property. | Land | Improvement |
|---|---|---|---|---|
| 2025 | $2,339 | $116,343 | $37,526 | $78,817 |
| 2024 | $2,339 | $114,063 | $36,791 | $77,272 |
| 2023 | $2,156 | $111,827 | $36,070 | $75,757 |
| 2022 | $2,045 | $109,635 | $35,363 | $74,272 |
| 2021 | $1,996 | $107,486 | $34,670 | $72,816 |
| 2020 | $1,981 | $106,385 | $34,315 | $72,070 |
| 2019 | $1,898 | $104,300 | $33,643 | $70,657 |
| 2018 | $1,760 | $102,256 | $32,984 | $69,272 |
| 2017 | $1,659 | $100,252 | $32,338 | $67,914 |
| 2016 | $1,086 | $98,287 | $31,704 | $66,583 |
| 2015 | $1,071 | $96,811 | $31,228 | $65,583 |
| 2014 | $1,055 | $94,916 | $30,617 | $64,299 |
Source: Public Records
Map
Nearby Homes