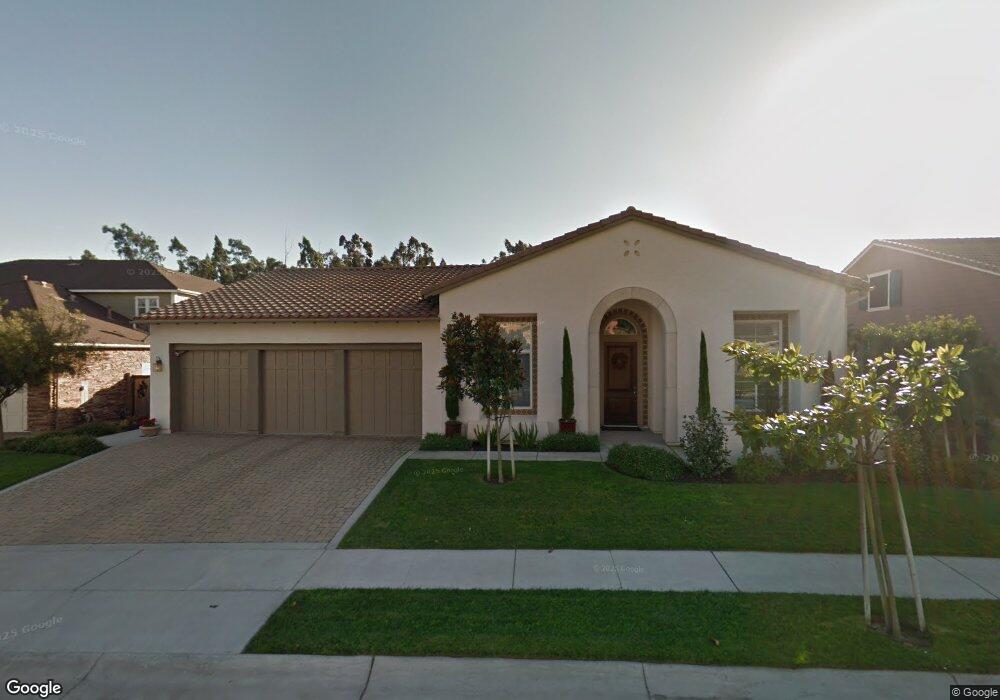
1719 Trilogy Pkwy Nipomo, CA 93444
Woodlands NeighborhoodEstimated Value: $1,746,000 - $1,889,000
3
Beds
4
Baths
3,223
Sq Ft
$564/Sq Ft
Est. Value
About This Home
This home is located at 1719 Trilogy Pkwy, Nipomo, CA 93444 and is currently estimated at $1,817,222, approximately $563 per square foot. 1719 Trilogy Pkwy is a home located in San Luis Obispo County with nearby schools including Dorothea Lange Elementary School, Mesa Middle School, and Nipomo High School.
Ownership History
Date
Name
Owned For
Owner Type
Purchase Details
Closed on
Aug 28, 2018
Sold by
Holmes Dale and Holmes Linda Challoner
Bought by
Cashin James A and Cashin Felicia M
Current Estimated Value
Purchase Details
Closed on
Jul 26, 2006
Sold by
Shea Homes Lp
Bought by
Holmes Dale and Holmes Linda Challoner
Home Financials for this Owner
Home Financials are based on the most recent Mortgage that was taken out on this home.
Original Mortgage
$791,970
Interest Rate
3.99%
Mortgage Type
New Conventional
Purchase Details
Closed on
Mar 23, 2006
Sold by
Shea Homes Lp
Bought by
Cohen Barry L and Cohen Mary Emily
Home Financials for this Owner
Home Financials are based on the most recent Mortgage that was taken out on this home.
Original Mortgage
$417,000
Interest Rate
6.25%
Mortgage Type
Fannie Mae Freddie Mac
Create a Home Valuation Report for This Property
The Home Valuation Report is an in-depth analysis detailing your home's value as well as a comparison with similar homes in the area
Home Values in the Area
Average Home Value in this Area
Purchase History
| Date | Buyer | Sale Price | Title Company |
|---|---|---|---|
| Cashin James A | $1,125,000 | Fidleity Naitonal Title | |
| Holmes Dale | $990,000 | First American Title Ins Co | |
| Cohen Barry L | $1,035,000 | First American Title Co |
Source: Public Records
Mortgage History
| Date | Status | Borrower | Loan Amount |
|---|---|---|---|
| Previous Owner | Holmes Dale | $791,970 | |
| Previous Owner | Cohen Barry L | $417,000 |
Source: Public Records
Tax History Compared to Growth
Tax History
| Year | Tax Paid | Tax Assessment Tax Assessment Total Assessment is a certain percentage of the fair market value that is determined by local assessors to be the total taxable value of land and additions on the property. | Land | Improvement |
|---|---|---|---|---|
| 2025 | $12,835 | $1,254,954 | $585,645 | $669,309 |
| 2024 | $12,686 | $1,230,348 | $574,162 | $656,186 |
| 2023 | $12,686 | $1,206,224 | $562,904 | $643,320 |
| 2022 | $12,493 | $1,182,573 | $551,867 | $630,706 |
| 2021 | $12,469 | $1,159,387 | $541,047 | $618,340 |
| 2020 | $12,326 | $1,147,500 | $535,500 | $612,000 |
| 2019 | $12,325 | $1,125,000 | $525,000 | $600,000 |
| 2018 | $11,969 | $1,084,000 | $520,000 | $564,000 |
| 2017 | $11,980 | $1,084,000 | $520,000 | $564,000 |
| 2016 | $11,142 | $1,048,000 | $505,000 | $543,000 |
| 2015 | $11,150 | $1,048,000 | $505,000 | $543,000 |
| 2014 | $9,707 | $929,000 | $445,000 | $484,000 |
Source: Public Records
Map
Nearby Homes
- 1783 Trilogy Pkwy
- 1685 Louise Ln
- 1849 Eucalyptus Rd
- 1156 Spring Azure Way
- 1153 Spring Azure Way
- 1187 Swallowtail Way
- 977 Jacqueline Place
- 961 Jacqueline Place
- 1539 Vista Tesoro Place
- 1160 Korey Ct
- 867 Trail View Place
- 1147 Vaquero Way
- 1175 Danielle Ct
- 1441 Vicki Ln
- 1455 Via Vista
- 1441 Via Vista
- 1084 Emma Ln
- 1245 Justin Ln
- 1354 Trail View Place
- 1195 Trail View Place
- 1715 Trilogy Pkwy
- 1725 Trilogy Pkwy
- 1718 Trilogy Pkwy
- 1709 Trilogy Pkwy
- 1735 Trilogy Pkwy
- 1722 Trilogy Pkwy
- 1712 Trilogy Pkwy
- 1705 Trilogy Pkwy
- 1730 Trilogy Pkwy
- 1739 Trilogy Pkwy Unit PY
- 1736 Trilogy Pkwy
- 1699 Trilogy Pkwy
- 1745 Trilogy Pkwy
- 1742 Trilogy Pkwy
- 1695 Trilogy Pkwy
- 1749 Trilogy Pkwy
- 1696 Trilogy Pkwy
- 1746 Trilogy Pkwy
- 1754 Kyle Ct