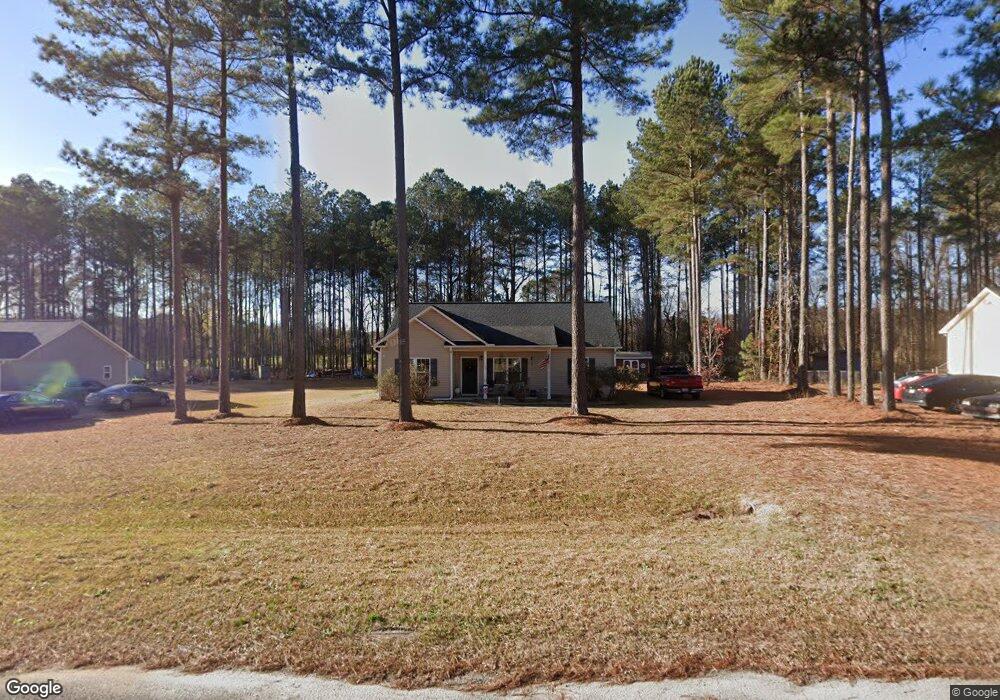
172 Jon Dr Unit 41R Smithfield, NC 27577
Estimated Value: $243,181 - $285,000
3
Beds
2
Baths
1,226
Sq Ft
$212/Sq Ft
Est. Value
About This Home
This home is located at 172 Jon Dr Unit 41R, Smithfield, NC 27577 and is currently estimated at $259,545, approximately $211 per square foot. 172 Jon Dr Unit 41R is a home located in Johnston County with nearby schools including West Smithfield Elementary School, Smithfield Middle School, and Smithfield-Selma High School.
Ownership History
Date
Name
Owned For
Owner Type
Purchase Details
Closed on
May 21, 2015
Sold by
Bradfield David
Bought by
J S & S Development Inc
Current Estimated Value
Home Financials for this Owner
Home Financials are based on the most recent Mortgage that was taken out on this home.
Original Mortgage
$105,056
Outstanding Balance
$81,831
Interest Rate
3.99%
Mortgage Type
FHA
Estimated Equity
$177,714
Purchase Details
Closed on
May 4, 2015
Sold by
Js & D Development Inc
Bought by
Bradfield David and Bradfield Particia
Home Financials for this Owner
Home Financials are based on the most recent Mortgage that was taken out on this home.
Original Mortgage
$105,056
Outstanding Balance
$81,831
Interest Rate
3.99%
Mortgage Type
FHA
Estimated Equity
$177,714
Create a Home Valuation Report for This Property
The Home Valuation Report is an in-depth analysis detailing your home's value as well as a comparison with similar homes in the area
Home Values in the Area
Average Home Value in this Area
Purchase History
| Date | Buyer | Sale Price | Title Company |
|---|---|---|---|
| J S & S Development Inc | $107,000 | -- | |
| Bradfield David | $107,000 | None Available |
Source: Public Records
Mortgage History
| Date | Status | Borrower | Loan Amount |
|---|---|---|---|
| Open | Bradfield David | $105,056 |
Source: Public Records
Tax History Compared to Growth
Tax History
| Year | Tax Paid | Tax Assessment Tax Assessment Total Assessment is a certain percentage of the fair market value that is determined by local assessors to be the total taxable value of land and additions on the property. | Land | Improvement |
|---|---|---|---|---|
| 2025 | $1,438 | $226,430 | $44,350 | $182,080 |
| 2024 | $975 | $120,400 | $23,390 | $97,010 |
| 2023 | $975 | $120,400 | $23,390 | $97,010 |
| 2022 | $999 | $120,400 | $23,390 | $97,010 |
| 2021 | $999 | $120,400 | $23,390 | $97,010 |
| 2020 | $1,030 | $120,400 | $23,390 | $97,010 |
| 2019 | $1,031 | $120,400 | $23,390 | $97,010 |
| 2018 | $914 | $103,570 | $19,760 | $83,810 |
| 2017 | $931 | $103,570 | $19,760 | $83,810 |
| 2016 | $938 | $103,570 | $19,760 | $83,810 |
| 2015 | $170 | $103,570 | $19,760 | $83,810 |
| 2014 | $170 | $19,760 | $19,760 | $0 |
Source: Public Records
Map
Nearby Homes