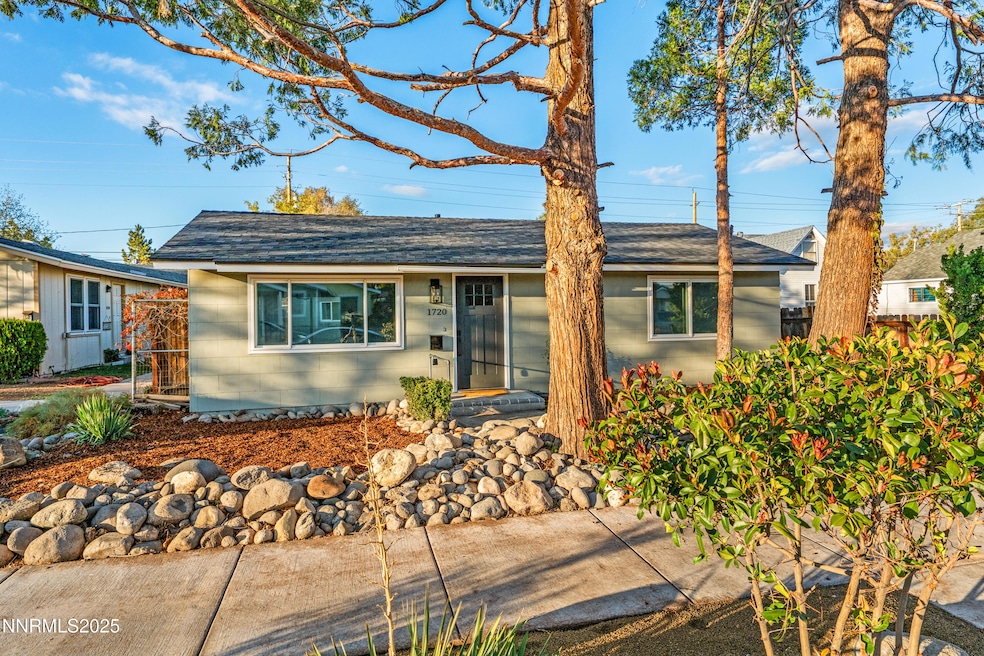


1720 G St Sparks, NV 89431
Downtown Sparks NeighborhoodEstimated payment $2,292/month
Highlights
- View of Trees or Woods
- Great Room
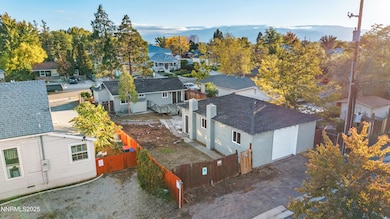
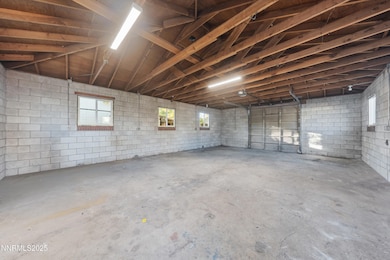
- 4 Car Detached Garage
- Deck
- No HOA
- 4-minute walk to Deer Park
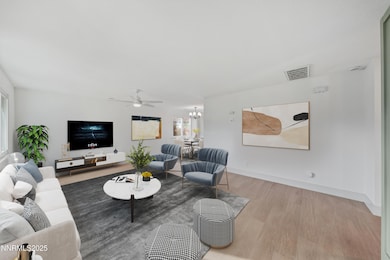
About This Home
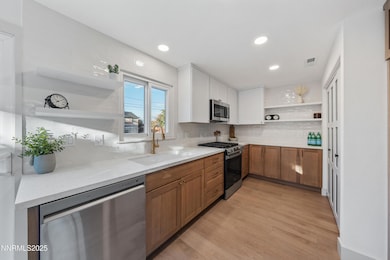
Seller Offering Closing Cost & Rate Buydown Incentives with Competitive Offer! Welcome to the mixed-use property you've been waiting for! This fully renovated gem in the heart of Sparks, NV features a rare 4-car garage and endless potential. Perfect for the at-home tinkerer, car enthusiast, or small-business owner, this property blends style and substance. She doesn't just look good, she's got the upgrades to back it up, including a new roof, new furnace, modern finishes, and all-new appliances. Located just around the corner from Victorian Square, you'll enjoy quick access to restaurants.
Co-Listing Agent
Hodges & Associates Real Estate Group
Real Broker LLC
Home Details
Home Type
- Single Family
Est. Annual Taxes
- $751
Year Built
- Built in 1970
Lot Details
- 6,011 Sq Ft Lot
- Back Yard Fenced
- Level Lot
- Property is zoned MUD
Parking
- 4 Car Detached Garage
Home Design
- Pitched Roof
- Composition Roof
- Wood Siding
- Stick Built Home
Interior Spaces
- 864 Sq Ft Home
- 1-Story Property
- Ceiling Fan
- Double Pane Windows
- Vinyl Clad Windows
- Great Room
- Laminate Flooring
- Views of Woods
- Crawl Space
- Laundry in Kitchen
Kitchen
- Built-In Oven
- Gas Oven
- Microwave
- Dishwasher
- Disposal
Bedrooms and Bathrooms
- 2 Bedrooms
- 1 Full Bathroom
Home Security
- Carbon Monoxide Detectors
- Fire and Smoke Detector
Outdoor Features
- Deck
- Patio
- Shed
Schools
- Smith Elementary School
- Sparks Middle School
- Sparks High School
Utilities
- Forced Air Heating and Cooling System
- Natural Gas Connected
- Gas Water Heater
- Internet Available
- Phone Available
- Cable TV Available
Community Details
- No Home Owners Association
- Sparks Community
- Newtown Tract Subdivision
- The community has rules related to covenants, conditions, and restrictions
Listing and Financial Details
- Assessor Parcel Number 031-272-11
Map
Home Values in the Area
Average Home Value in this Area
Tax History
| Year | Tax Paid | Tax Assessment Tax Assessment Total Assessment is a certain percentage of the fair market value that is determined by local assessors to be the total taxable value of land and additions on the property. | Land | Improvement |
|---|---|---|---|---|
| 2025 | $1,943 | $46,367 | $31,675 | $14,692 |
| 2024 | $1,943 | $42,346 | $27,860 | $14,486 |
| 2023 | $677 | $44,030 | $30,625 | $13,405 |
| 2022 | $659 | $33,470 | $22,680 | $10,790 |
| 2021 | $645 | $26,860 | $16,275 | $10,585 |
| 2020 | $626 | $26,229 | $15,820 | $10,409 |
| 2019 | $608 | $24,168 | $13,615 | $10,553 |
| 2018 | $590 | $20,896 | $10,220 | $10,676 |
| 2017 | $574 | $20,593 | $9,555 | $11,038 |
| 2016 | $560 | $19,078 | $7,420 | $11,658 |
| 2015 | $559 | $17,269 | $5,775 | $11,494 |
| 2014 | $541 | $15,172 | $3,815 | $11,357 |
| 2013 | -- | $14,274 | $2,730 | $11,544 |
Property History
| Date | Event | Price | List to Sale | Price per Sq Ft |
|---|---|---|---|---|
| 11/13/2025 11/13/25 | Price Changed | $424,900 | -5.6% | $492 / Sq Ft |
| 10/17/2025 10/17/25 | For Sale | $449,900 | -- | $521 / Sq Ft |
Purchase History
| Date | Type | Sale Price | Title Company |
|---|---|---|---|
| Trustee Deed | $230,000 | None Listed On Document | |
| Bargain Sale Deed | $260,000 | Stewart Title | |
| Bargain Sale Deed | -- | None Available | |
| Interfamily Deed Transfer | -- | None Available | |
| Grant Deed | $95,500 | Western Title Company Inc |
Mortgage History
| Date | Status | Loan Amount | Loan Type |
|---|---|---|---|
| Previous Owner | $255,290 | FHA | |
| Previous Owner | $85,950 | No Value Available |
Source: Northern Nevada Regional MLS
MLS Number: 250057150
APN: 031-272-11
Disclaimer: Certain information contained herein is derived from information provided by parties other than Homes.com. All information provided is deemed reliable, but is not guaranteed to be accurate and should be independently verified.
![]() IDX information is provided exclusively for personal, non-commercial use, and may not be used for any purpose other than to identify prospective properties consumers may be interested in purchasing. Information is deemed reliable but not guaranteed. The content relating to real estate for sale on this web site comes in part from the Broker Reciprocity/ IDX program of the Northern Nevada Regional Multiple Listing Service°. Real estate listings held by brokerage firms other than Ten-X are marked with the Broker Reciprocity logo and detailed information about those listings includes the name of the listing brokerage. Any use of the content other than by a search performed by a consumer looking to purchase or rent real estate is prohibited. © 2025 Northern Nevada Regional Multiple Listing Service® MLS. All rights reserved.
IDX information is provided exclusively for personal, non-commercial use, and may not be used for any purpose other than to identify prospective properties consumers may be interested in purchasing. Information is deemed reliable but not guaranteed. The content relating to real estate for sale on this web site comes in part from the Broker Reciprocity/ IDX program of the Northern Nevada Regional Multiple Listing Service°. Real estate listings held by brokerage firms other than Ten-X are marked with the Broker Reciprocity logo and detailed information about those listings includes the name of the listing brokerage. Any use of the content other than by a search performed by a consumer looking to purchase or rent real estate is prohibited. © 2025 Northern Nevada Regional Multiple Listing Service® MLS. All rights reserved.
- 848 Rock Blvd
- 1756 I St
- 973 Damon Ln
- 1536 Irene Way
- 1560 Steven Ct Unit 2
- 1830 C St
- 1527 Steven Ct
- 234 18th St
- 1841 Merchant St
- 1889 Merchant St
- 2136 Roundhouse Rd
- 2168 Cannonball Rd
- 1855 Verano Dr
- 1010 12th St
- 2335 Roundhouse Rd
- 2380 Roundhouse Rd
- 2385 Pauline Ave
- 1780 Greenbrae Dr
- 1365 Prospect Ave
- 829 10th St
- 1844 H St Unit 1
- 1846 H St
- 1600 I St Unit 2205
- 1600 I St Unit 1305
- 1600 I St Unit 1105
- 1600 I St Unit 1307
- 1600 I St Unit 2104
- 1600 I St Unit 1306
- 1539 G St Unit C
- 1080-1098 Rock Blvd
- 314 Rock Blvd
- 236 18th St
- 1260 Commerce St
- 1835 Oddie Blvd
- 1400 Avenue of The Oaks
- 1100 15th St
- 1415 C St
- 2127 Roundhouse Rd
- 1125-1130 Avenue of The Oaks
- 1040 C St
