
Landlord's Agent in 2021
Jeffrey Stewart
@ Properties
(773) 862-0200
73 Total Sales

Estimated Value: $262,617 - $271,000
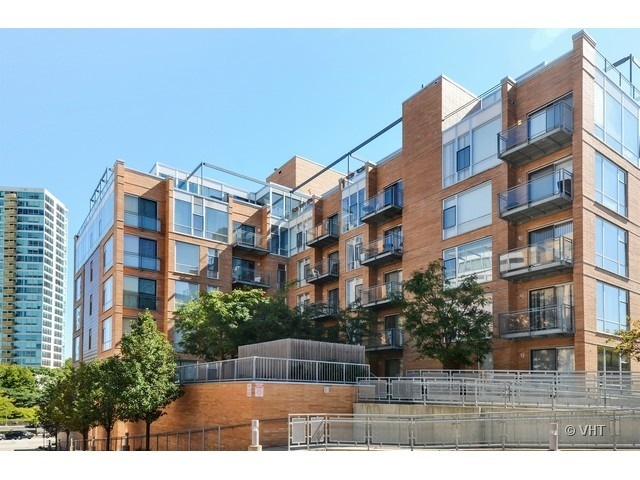
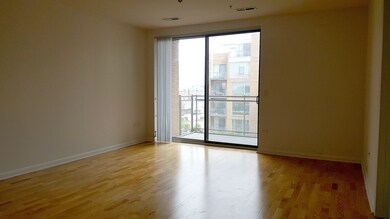
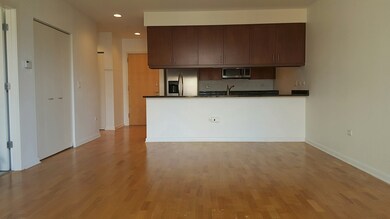
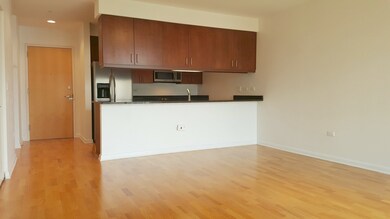
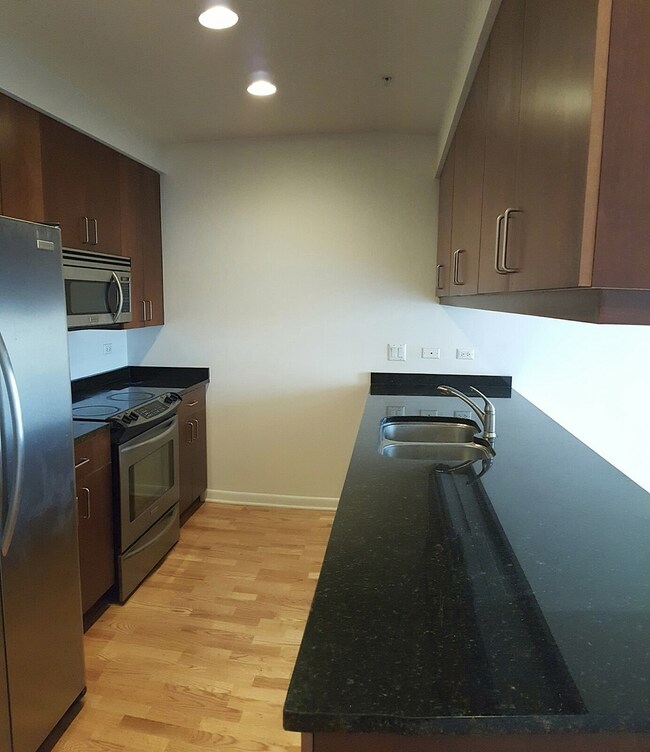
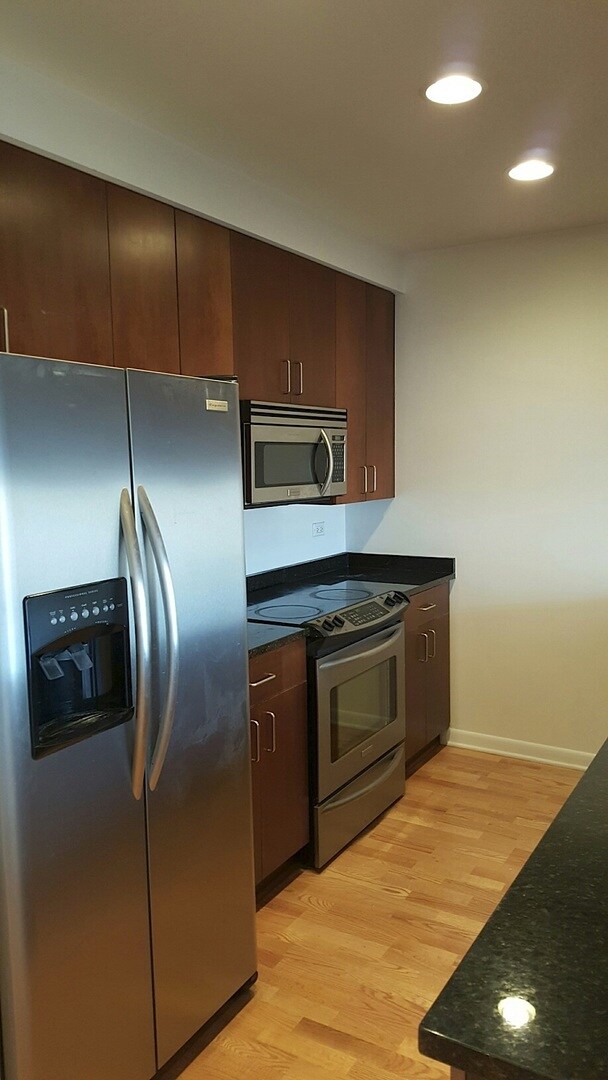
Updated north-facing 1BD/1BA in the heart of Evanston just steps from Purple Line & Metra transit lines, restaurants, bars, retail & more! Living/dining room features wood floors & large sliding glass door leading to balcony w/north views. Kitchen has dark granite counters w/large breakfast bar, SS appliances & lots of cabinet & counter space. King-sized primary bedroom features floor to ceiling window & large organized walk-in closet. Bathroom has jacuzzi tub, single granite vanity w/addtl storage & linen closet for even more storage! In-unit W/D, heated/enclosed garage parking space, addtl storage cage & heat INCLUDED in rent! One pet up to 25lbs OK for addtl $25/mo pet rent.
Last Agent to Rent the Property
@properties Christie's International Real Estate Listed on: 06/01/2021
Last Renter's Agent
Non Member
NON MEMBER
Home Type
Est. Annual Taxes
Year Built
Lot Details
Parking
Interior Spaces
Kitchen
Bedrooms and Bathrooms
Laundry
Home Security
Accessible Home Design
Outdoor Features
Utilities
Listing and Financial Details
Overview
Amenities
Recreation
Pet Policy
Security
| Date | Buyer | Sale Price | Title Company |
|---|---|---|---|
| Wong Melinda | $285,000 | Ticor |
| Date | Status | Borrower | Loan Amount |
|---|---|---|---|
| Open | Wong Melinda | $223,500 | |
| Closed | Wong Melinda | $28,490 | |
| Previous Owner | Wong Melinda | $227,920 |
| Date | Event | Price | Change | Sq Ft Price |
|---|---|---|---|---|
| 06/14/2021 06/14/21 | Rented | -- | -- | -- |
| 06/01/2021 06/01/21 | For Rent | $1,700 | -2.9% | -- |
| 05/18/2020 05/18/20 | Rented | $1,750 | 0.0% | -- |
| 05/11/2020 05/11/20 | For Rent | $1,750 | 0.0% | -- |
| 05/29/2018 05/29/18 | Rented | $1,750 | 0.0% | -- |
| 05/20/2018 05/20/18 | Under Contract | -- | -- | -- |
| 05/10/2018 05/10/18 | For Rent | $1,750 | -- | -- |
| Year | Tax Paid | Tax Assessment Tax Assessment Total Assessment is a certain percentage of the fair market value that is determined by local assessors to be the total taxable value of land and additions on the property. | Land | Improvement |
|---|---|---|---|---|
| 2024 | $3,956 | $19,659 | $1,766 | $17,893 |
| 2023 | $3,772 | $19,659 | $1,766 | $17,893 |
| 2022 | $3,772 | $19,659 | $1,766 | $17,893 |
| 2021 | $3,705 | $17,290 | $1,164 | $16,126 |
| 2020 | $3,715 | $17,290 | $1,164 | $16,126 |
| 2019 | $3,683 | $19,150 | $1,164 | $17,986 |
| 2018 | $3,798 | $17,297 | $963 | $16,334 |
| 2017 | $3,715 | $17,297 | $963 | $16,334 |
| 2016 | $3,745 | $17,297 | $963 | $16,334 |
| 2015 | $3,107 | $14,212 | $296 | $13,916 |
| 2014 | $3,092 | $14,212 | $296 | $13,916 |
| 2013 | $3,005 | $14,212 | $691 | $13,521 |
Landlord's Agent in 2021
Jeffrey Stewart
@ Properties
(773) 862-0200
73 Total Sales
N
Tenant's Agent in 2021
Non Member
NON MEMBER
Buyer's Agent in 2018
Donna Agnew
@ Properties
(847) 644-3413
1 in this area
56 Total Sales
Source: Midwest Real Estate Data (MRED)
MLS Number: MRD11106326
APN: 11-18-122-035-1040
Disclaimer: Certain information contained herein is derived from information provided by parties other than Homes.com. All information provided is deemed reliable, but is not guaranteed to be accurate and should be independently verified.
![]() Based on information submitted to the MLS GRID. All data is obtained from various sources and may not have been verified by broker or MLS GRID. Supplied Open House Information is subject to change without notice. All information should be independently reviewed and verified for accuracy. Properties may or may not be listed by the office/agent presenting the information. Some IDX listings have been excluded from this website.
Based on information submitted to the MLS GRID. All data is obtained from various sources and may not have been verified by broker or MLS GRID. Supplied Open House Information is subject to change without notice. All information should be independently reviewed and verified for accuracy. Properties may or may not be listed by the office/agent presenting the information. Some IDX listings have been excluded from this website.
The Digital Millennium Copyright Act of 1998, 17 U.S.C. § 512 (the “DMCA”) provides recourse for copyright owners who believe that material appearing on the Internet infringes their rights under U.S. copyright law. If you believe in good faith that any content or material made available in connection with our website or services infringes your copyright, you (or your agent) may send us a notice requesting that the content or material be removed, or access to it blocked.
Notices must be sent in writing by email to DMCAnotice@MLSGrid.com.
The DMCA requires that your notice of alleged copyright infringement include the following information:
(1) description of the copyrighted work that is the subject of claimed infringement;
(2) description of the alleged infringing content and information sufficient to permit us to locate the content;
(3) contact information for you, including your address, telephone number and email address;
(4) a statement by you that you have a good faith belief that the content in the manner complained of is not authorized by the copyright owner, or its agent, or by the operation of any law;
(5) a statement by you, signed under penalty of perjury, that the information in the notification is accurate and that you have the authority to enforce the copyrights that are claimed to be infringed; and
(6) a physical or electronic signature of the copyright owner or a person authorized to act on the copyright owner’s behalf. Failure to include all of the above information may result in the delay of the processing of your complaint.