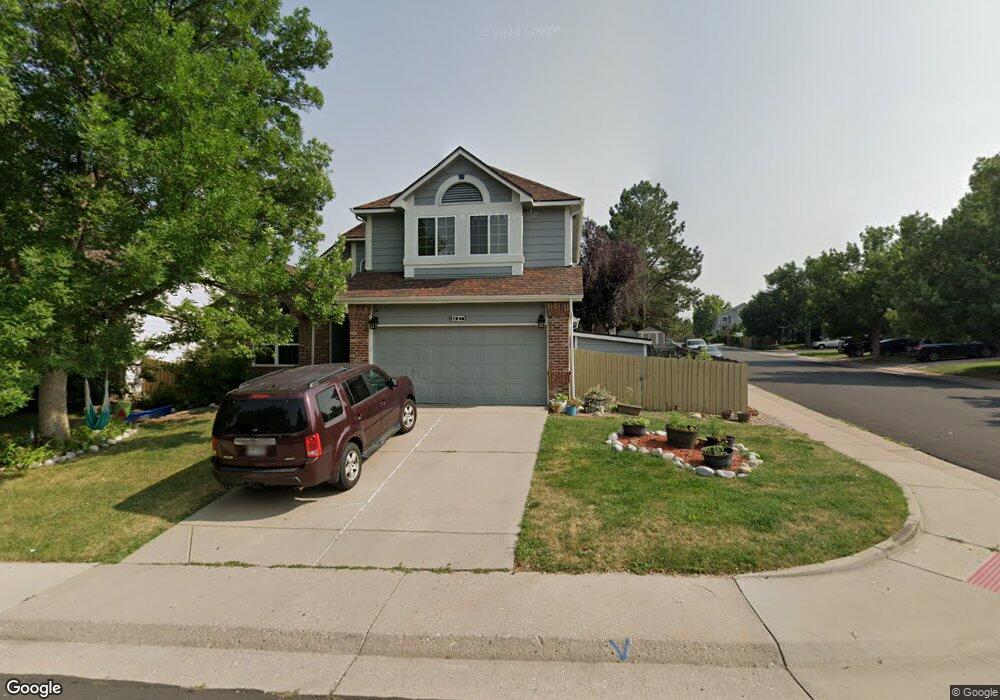
17202 Niwot Place Parker, CO 80134
Clarke Farms NeighborhoodEstimated Value: $577,000 - $593,392
4
Beds
4
Baths
2,507
Sq Ft
$234/Sq Ft
Est. Value
About This Home
This home is located at 17202 Niwot Place, Parker, CO 80134 and is currently estimated at $586,848, approximately $234 per square foot. 17202 Niwot Place is a home located in Douglas County with nearby schools including Cherokee Trail Elementary School, Sierra Middle School, and Chaparral High School.
Ownership History
Date
Name
Owned For
Owner Type
Purchase Details
Closed on
Apr 30, 2012
Sold by
Hendreks Todd and Hendreks Lisa
Bought by
Morris Michael Tyler and Fraley Maegen
Current Estimated Value
Home Financials for this Owner
Home Financials are based on the most recent Mortgage that was taken out on this home.
Original Mortgage
$229,017
Outstanding Balance
$158,451
Interest Rate
3.87%
Mortgage Type
FHA
Estimated Equity
$428,397
Purchase Details
Closed on
Mar 25, 2004
Sold by
Vonfeldt Gerald R and Vonfeldt Patricia S
Bought by
Hendreks Todd and Hendreks Lisa
Home Financials for this Owner
Home Financials are based on the most recent Mortgage that was taken out on this home.
Original Mortgage
$183,920
Interest Rate
5.64%
Mortgage Type
Unknown
Create a Home Valuation Report for This Property
The Home Valuation Report is an in-depth analysis detailing your home's value as well as a comparison with similar homes in the area
Home Values in the Area
Average Home Value in this Area
Purchase History
| Date | Buyer | Sale Price | Title Company |
|---|---|---|---|
| Morris Michael Tyler | $235,000 | None Available | |
| Hendreks Todd | $229,900 | Land Title Guarantee Company |
Source: Public Records
Mortgage History
| Date | Status | Borrower | Loan Amount |
|---|---|---|---|
| Open | Morris Michael Tyler | $229,017 | |
| Previous Owner | Hendreks Todd | $183,920 | |
| Closed | Hendreks Todd | $45,980 |
Source: Public Records
Tax History Compared to Growth
Tax History
| Year | Tax Paid | Tax Assessment Tax Assessment Total Assessment is a certain percentage of the fair market value that is determined by local assessors to be the total taxable value of land and additions on the property. | Land | Improvement |
|---|---|---|---|---|
| 2024 | $3,384 | $42,420 | $8,680 | $33,740 |
| 2023 | $3,425 | $42,420 | $8,680 | $33,740 |
| 2022 | $2,553 | $29,530 | $5,220 | $24,310 |
| 2021 | $2,658 | $29,530 | $5,220 | $24,310 |
| 2020 | $2,537 | $28,660 | $4,940 | $23,720 |
| 2019 | $2,553 | $28,660 | $4,940 | $23,720 |
| 2017 | $2,123 | $25,030 | $4,960 | $20,070 |
| 2016 | $1,902 | $22,020 | $4,220 | $17,800 |
| 2015 | $1,937 | $22,020 | $4,220 | $17,800 |
| 2014 | $924 | $18,720 | $4,220 | $14,500 |
Source: Public Records
Map
Nearby Homes
- 11632 Masonville Dr
- 11629 Masonville Dr
- 11613 Masonville Dr
- 17502 Lamar Ct
- 10371 Knollside Dr
- 17046 Wellington Dr
- 10414 Stonewillow Dr
- 10354 Severance Dr
- 10721 Kimball St
- 10505 Berthoud Way
- 17033 Numa Place
- 16641 Martingale Dr
- 17050 E Wiley Place
- 10811 Shaw Ct
- 10607 Clarke Farms Dr
- 17130 Opal Hill Dr
- 10535 Holyoke Dr
- 16642 Autumn Rock Cove
- 16362 Oakmoor Place
- 17351 Cornerstone Dr
- 17204 Niwot Place
- 17103 Campion Way
- 17105 Campion Way
- 17206 Niwot Place
- 11510 Wray Ct
- 17107 Campion Way
- 11507 Wray Ct
- 11503 Wray Ct
- 17109 Campion Way
- 11501 Wray Ct
- 11509 Wray Ct
- 17208 Niwot Place
- 11512 Wray Ct
- 17207 Niwot Place
- 17111 Campion Way
- 11511 Wray Ct
- 17210 Niwot Place
- 11618 Masonville Dr
- 17113 Campion Way
- 11620 Masonville Dr