1721 Q St NW Unit G6 Washington, DC 20009
Dupont Circle NeighborhoodEstimated Value: $248,037 - $314,000
1
Bed
1
Bath
300
Sq Ft
$923/Sq Ft
Est. Value
About This Home
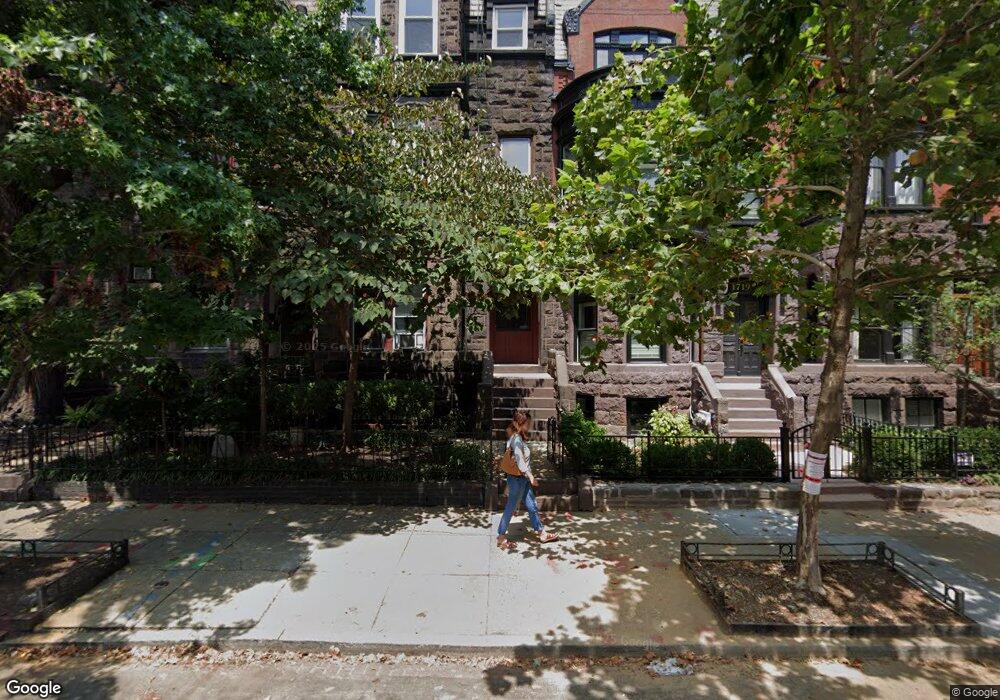
This home is located at 1721 Q St NW Unit G6, Washington, DC 20009 and is currently estimated at $276,759, approximately $922 per square foot. 1721 Q St NW Unit G6 is a home located in District of Columbia with nearby schools including Ross Elementary School, Cardozo Education Campus, and St. Augustine School.
Ownership History
Date
Name
Owned For
Owner Type
Purchase Details
Closed on
Aug 16, 2019
Sold by
Whitman Dana L and Whitman Hayter Lamar
Bought by
Koenig Cary
Current Estimated Value
Home Financials for this Owner
Home Financials are based on the most recent Mortgage that was taken out on this home.
Original Mortgage
$273,152
Outstanding Balance
$239,231
Interest Rate
3.7%
Mortgage Type
New Conventional
Estimated Equity
$37,528
Purchase Details
Closed on
Jul 13, 2007
Sold by
Ellis Marcus
Bought by
Wyrsch Edward
Home Financials for this Owner
Home Financials are based on the most recent Mortgage that was taken out on this home.
Original Mortgage
$177,600
Interest Rate
6.54%
Mortgage Type
New Conventional
Purchase Details
Closed on
Sep 8, 2006
Sold by
Trust Dsp Venture Group
Bought by
Ellis Marcus D
Home Financials for this Owner
Home Financials are based on the most recent Mortgage that was taken out on this home.
Original Mortgage
$174,400
Interest Rate
6.71%
Mortgage Type
New Conventional
Purchase Details
Closed on
Feb 1, 2006
Sold by
Ruch Walter
Bought by
1721 O Street Nw Land Trust Ds
Create a Home Valuation Report for This Property
The Home Valuation Report is an in-depth analysis detailing your home's value as well as a comparison with similar homes in the area
Home Values in the Area
Average Home Value in this Area
Purchase History
| Date | Buyer | Sale Price | Title Company |
|---|---|---|---|
| Koenig Cary | $281,600 | Kvs Title Llc | |
| Wyrsch Edward | $222,000 | -- | |
| Ellis Marcus D | $218,000 | -- | |
| 1721 O Street Nw Land Trust Ds | $80,600 | -- |
Source: Public Records
Mortgage History
| Date | Status | Borrower | Loan Amount |
|---|---|---|---|
| Open | Koenig Cary | $273,152 | |
| Previous Owner | Wyrsch Edward | $177,600 | |
| Previous Owner | Ellis Marcus D | $174,400 |
Source: Public Records
Tax History Compared to Growth
Tax History
| Year | Tax Paid | Tax Assessment Tax Assessment Total Assessment is a certain percentage of the fair market value that is determined by local assessors to be the total taxable value of land and additions on the property. | Land | Improvement |
|---|---|---|---|---|
| 2024 | $1,215 | $245,220 | $73,570 | $171,650 |
| 2023 | $1,299 | $251,500 | $75,450 | $176,050 |
| 2022 | $1,344 | $250,540 | $75,160 | $175,380 |
| 2021 | $1,234 | $253,440 | $76,030 | $177,410 |
| 2020 | $1,230 | $220,380 | $66,110 | $154,270 |
| 2019 | $1,845 | $217,110 | $65,130 | $151,980 |
| 2018 | $1,827 | $214,960 | $0 | $0 |
| 2017 | $1,828 | $215,020 | $0 | $0 |
| 2016 | $1,806 | $212,450 | $0 | $0 |
| 2015 | $1,760 | $207,000 | $0 | $0 |
| 2014 | -- | $195,060 | $0 | $0 |
Source: Public Records
Map
Nearby Homes
- 1601 18th St NW Unit 312
- 1545 18th St NW Unit 411
- 1545 18th St NW Unit 403
- 1545 18th St NW Unit 303
- 1718 Corcoran St NW Unit 5
- 1718 Corcoran St NW Unit 23
- 1775 Church St NW Unit 8
- 1719 Corcoran St NW Unit 1
- 1719 Corcoran St NW Unit 2
- 1737 Church St NW
- 1762 Church St NW
- 1526 17th St NW Unit 205
- 1526 17th St NW Unit 115
- 1526 17th St NW Unit 405
- 1514 17th St NW Unit 412
- 1514 17th St NW Unit 4
- 1514 17th St NW Unit B6
- 1514 17th St NW Unit 111
- 1514 17th St NW Unit 311
- 1514 17th St NW Unit 511
- 1721 Q St NW Unit 103
- 1721 Q St NW Unit G5
- 1721 Q St NW Unit 104
- 1721 Q St NW Unit 203
- 1721 Q St NW Unit 303
- 1723 Q St NW Unit 102
- 1723 Q St NW Unit 302
- 1723 Q St NW Unit 202
- 1723 Q St NW Unit G4
- 1723 Q St NW
- 1723 Q St NW Unit G6
- 1719 Q St NW
- 1719 Q St NW Unit BASEMENT
- 1719 Q St NW Unit B
- 1725 Q St NW Unit G-2
- 1725 Q St NW Unit 101
- 1725 Q St NW Unit 301
- 1725 Q St NW Unit 201
- 1725 Q St NW Unit 101
- 1725 Q St NW Unit G1