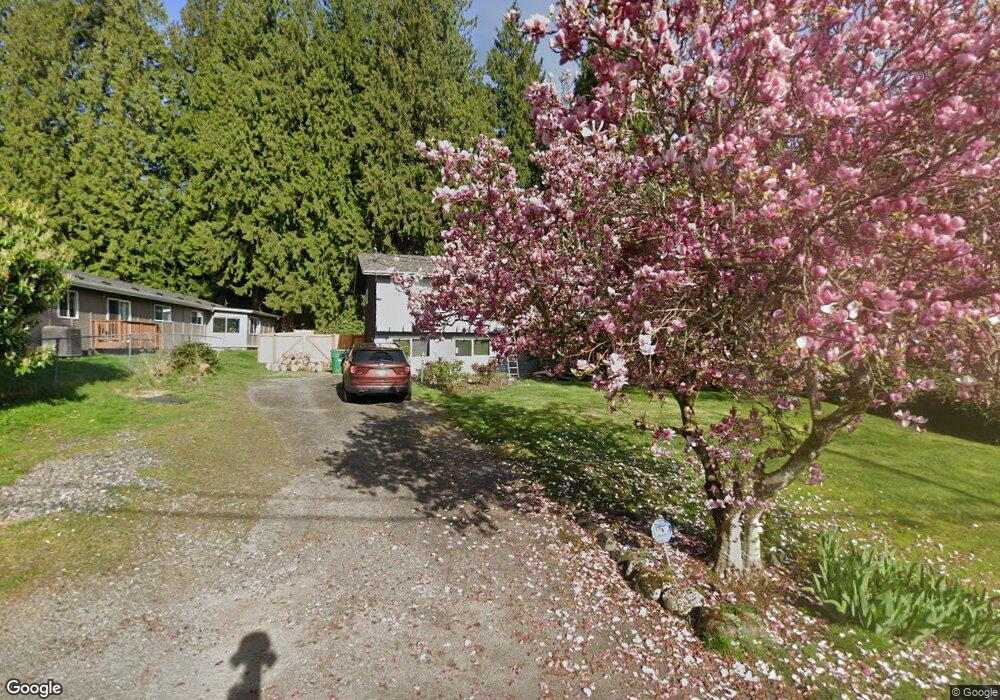
17210 Gravenstein Rd Bothell, WA 98012
Estimated Value: $739,000 - $871,000
3
Beds
3
Baths
1,174
Sq Ft
$701/Sq Ft
Est. Value
About This Home
This home is located at 17210 Gravenstein Rd, Bothell, WA 98012 and is currently estimated at $822,612, approximately $700 per square foot. 17210 Gravenstein Rd is a home located in Snohomish County with nearby schools including Martha Lake Elementary School, Alderwood Middle School, and Lynnwood High School.
Ownership History
Date
Name
Owned For
Owner Type
Purchase Details
Closed on
Jan 28, 2003
Sold by
Stallings Michael A and Stallings Nancy L
Bought by
Osberg Philip N and Zeigler Crystal L
Current Estimated Value
Home Financials for this Owner
Home Financials are based on the most recent Mortgage that was taken out on this home.
Original Mortgage
$236,292
Outstanding Balance
$95,829
Interest Rate
5.97%
Mortgage Type
FHA
Estimated Equity
$726,783
Purchase Details
Closed on
Jul 26, 1994
Sold by
Techet Wayne H and Techet Joyce L
Bought by
Stallings Michael A and Stallings Nancy L
Home Financials for this Owner
Home Financials are based on the most recent Mortgage that was taken out on this home.
Original Mortgage
$150,750
Interest Rate
5.25%
Create a Home Valuation Report for This Property
The Home Valuation Report is an in-depth analysis detailing your home's value as well as a comparison with similar homes in the area
Home Values in the Area
Average Home Value in this Area
Purchase History
| Date | Buyer | Sale Price | Title Company |
|---|---|---|---|
| Osberg Philip N | $240,000 | First American Title Ins Co | |
| Stallings Michael A | $167,500 | Transamerica Title Ins Co |
Source: Public Records
Mortgage History
| Date | Status | Borrower | Loan Amount |
|---|---|---|---|
| Open | Osberg Philip N | $236,292 | |
| Previous Owner | Stallings Michael A | $150,750 |
Source: Public Records
Tax History
| Year | Tax Paid | Tax Assessment Tax Assessment Total Assessment is a certain percentage of the fair market value that is determined by local assessors to be the total taxable value of land and additions on the property. | Land | Improvement |
|---|---|---|---|---|
| 2026 | $5,778 | $761,700 | $527,300 | $234,400 |
| 2025 | $5,660 | $696,500 | $500,000 | $196,500 |
| 2024 | $5,660 | $679,900 | $490,000 | $189,900 |
| 2023 | $5,879 | $738,800 | $540,000 | $198,800 |
| 2022 | $5,320 | $543,500 | $373,000 | $170,500 |
| 2020 | $4,864 | $438,900 | $293,000 | $145,900 |
| 2019 | $4,408 | $395,200 | $250,000 | $145,200 |
| 2018 | $4,429 | $350,000 | $220,000 | $130,000 |
| 2017 | $3,716 | $303,200 | $185,000 | $118,200 |
| 2016 | $3,347 | $273,400 | $160,000 | $113,400 |
| 2015 | $3,223 | $249,900 | $138,000 | $111,900 |
| 2013 | $3,134 | $231,100 | $140,000 | $91,100 |
Source: Public Records
Map
Nearby Homes
- 118 171st Place SW Unit B
- 17419 Gravenstein Rd
- 115 170th St SE
- 24 174th Place SW
- 118 169th Place SW Unit B
- 114 169th Place SW Unit B
- 110 169th Place SW Unit A
- 110 169th Place SW Unit B
- 207 169th Place SW
- 17210 4th Dr SE
- 17407 3rd Ave SE
- 16719 1st Ave SE
- 312 168th Place SE
- 311 168th Place SE
- 16528 2nd Park SE
- 16918 6th Ave W
- 129 164th Place SE
- 16820 6th Ave W Unit B11
- 0 Adjacent To Baldwin Rd
- 16230 3rd Ave SE Unit A1
- 1 172nd Place SW
- 17204 Gravenstein Rd
- 21 172nd Place SW
- 5 172nd Place SW
- 17124 Gravenstein Rd
- 11 172nd Place SW
- 17130 Gravenstein Rd
- 4 172nd Place SW
- 111 172nd Place SE
- 17205 Gravenstein Rd
- 17116 Gravenstein Rd
- 19 172nd Place SW
- 17305 Clover Rd
- 17230 Gravenstein Rd
- 100 172nd Place SE
- 16 172nd Place SW
- 104 172nd Place SE
- 27 172nd Place SW
- 17026 1st Ave SE
Your Personal Tour Guide
Ask me questions while you tour the home.