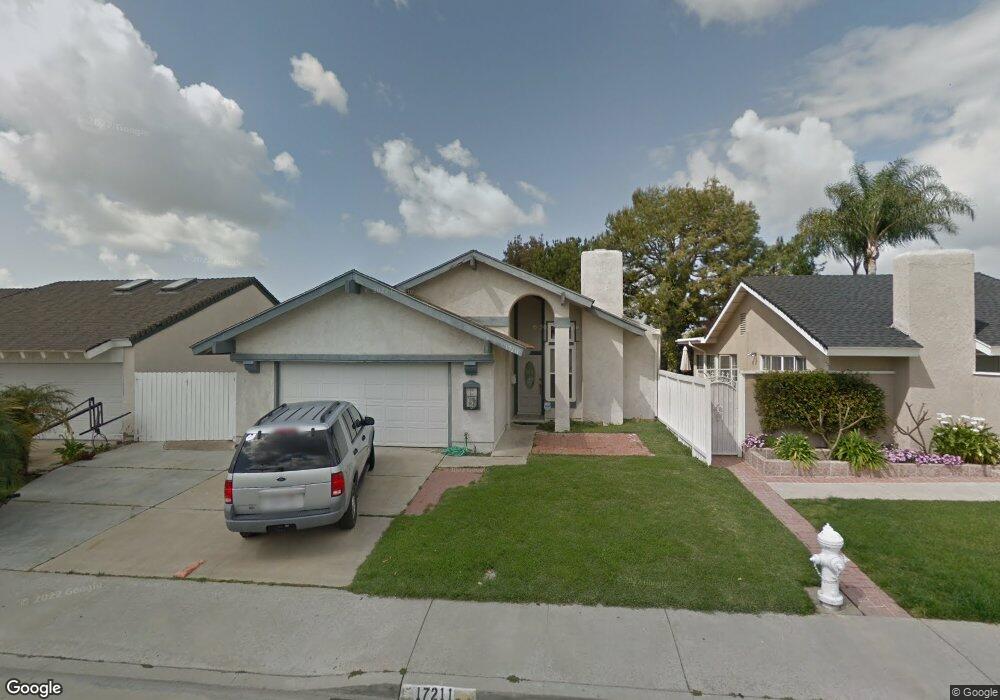
17211 Reimer St Fountain Valley, CA 92708
Estimated Value: $1,166,000 - $1,301,000
3
Beds
2
Baths
1,455
Sq Ft
$835/Sq Ft
Est. Value
About This Home
This home is located at 17211 Reimer St, Fountain Valley, CA 92708 and is currently estimated at $1,215,098, approximately $835 per square foot. 17211 Reimer St is a home located in Orange County with nearby schools including Cox (James H.) Elementary School, Masuda (Kazuo) Middle School, and Fountain Valley High School.
Ownership History
Date
Name
Owned For
Owner Type
Purchase Details
Closed on
Oct 27, 2003
Sold by
Fikse Cynthia J
Bought by
Peterson Lance K and Peterson Sylvia E
Current Estimated Value
Home Financials for this Owner
Home Financials are based on the most recent Mortgage that was taken out on this home.
Original Mortgage
$255,000
Outstanding Balance
$117,726
Interest Rate
5.94%
Mortgage Type
Purchase Money Mortgage
Estimated Equity
$1,097,372
Purchase Details
Closed on
May 15, 2001
Sold by
Murray Richard C and Murray Jane C
Bought by
Fikse Cynthia J
Home Financials for this Owner
Home Financials are based on the most recent Mortgage that was taken out on this home.
Original Mortgage
$240,000
Interest Rate
7.14%
Mortgage Type
Stand Alone First
Create a Home Valuation Report for This Property
The Home Valuation Report is an in-depth analysis detailing your home's value as well as a comparison with similar homes in the area
Home Values in the Area
Average Home Value in this Area
Purchase History
| Date | Buyer | Sale Price | Title Company |
|---|---|---|---|
| Peterson Lance K | $470,000 | North American Title Co | |
| Fikse Cynthia J | $330,000 | Orange Coast Title |
Source: Public Records
Mortgage History
| Date | Status | Borrower | Loan Amount |
|---|---|---|---|
| Open | Peterson Lance K | $255,000 | |
| Previous Owner | Fikse Cynthia J | $240,000 |
Source: Public Records
Tax History Compared to Growth
Tax History
| Year | Tax Paid | Tax Assessment Tax Assessment Total Assessment is a certain percentage of the fair market value that is determined by local assessors to be the total taxable value of land and additions on the property. | Land | Improvement |
|---|---|---|---|---|
| 2025 | $7,377 | $668,232 | $565,974 | $102,258 |
| 2024 | $7,377 | $655,130 | $554,877 | $100,253 |
| 2023 | $7,203 | $642,285 | $543,997 | $98,288 |
| 2022 | $7,097 | $629,692 | $533,331 | $96,361 |
| 2021 | $6,960 | $617,346 | $522,874 | $94,472 |
| 2020 | $6,919 | $611,016 | $517,512 | $93,504 |
| 2019 | $6,776 | $599,036 | $507,365 | $91,671 |
| 2018 | $6,645 | $587,291 | $497,417 | $89,874 |
| 2017 | $6,539 | $575,776 | $487,664 | $88,112 |
| 2016 | $6,256 | $564,487 | $478,102 | $86,385 |
| 2015 | $6,160 | $556,008 | $470,920 | $85,088 |
| 2014 | $6,038 | $545,117 | $461,695 | $83,422 |
Source: Public Records
Map
Nearby Homes
- 17071 Ward St
- 17077 Los Modelos St
- 10452 Circulo de Juarez
- 10322 Avenida Cinco de Mayo
- 17288 San Lorenzo Cir
- 18021 Roch Ct
- 18016 Roch Ct
- 17210 San Mateo St Unit 25
- 17401 Hood Ct
- 10430 La Cebra Ave
- 10900 La Flor Ave
- 17333 Brookhurst St Unit D6
- 17333 Brookhurst St Unit B7
- 11356 Stonecress Ave
- 17168 Newhope St Unit 222
- 11620 Warner Ave Unit 624
- 17200 Newhope St Unit 109
- 17200 Newhope St Unit 217
- 16379 Shadbush St
- 17215 Buttonwood St
- 17201 Reimer St
- 17219 Reimer St
- 17193 Reimer St
- 17229 Reimer St
- 17186 San Ricardo St
- 17198 San Ricardo St
- 17174 San Ricardo St
- 17210 San Ricardo Cir
- 17183 Reimer St
- 17237 Reimer St
- 17216 Reimer St
- 17198 Reimer St
- 17226 Reimer St
- 17162 San Ricardo St
- 17190 Reimer St
- 17222 San Ricardo Cir
- 17173 Reimer St
- 17247 Reimer St
- 17236 Reimer St
- 17180 Reimer St