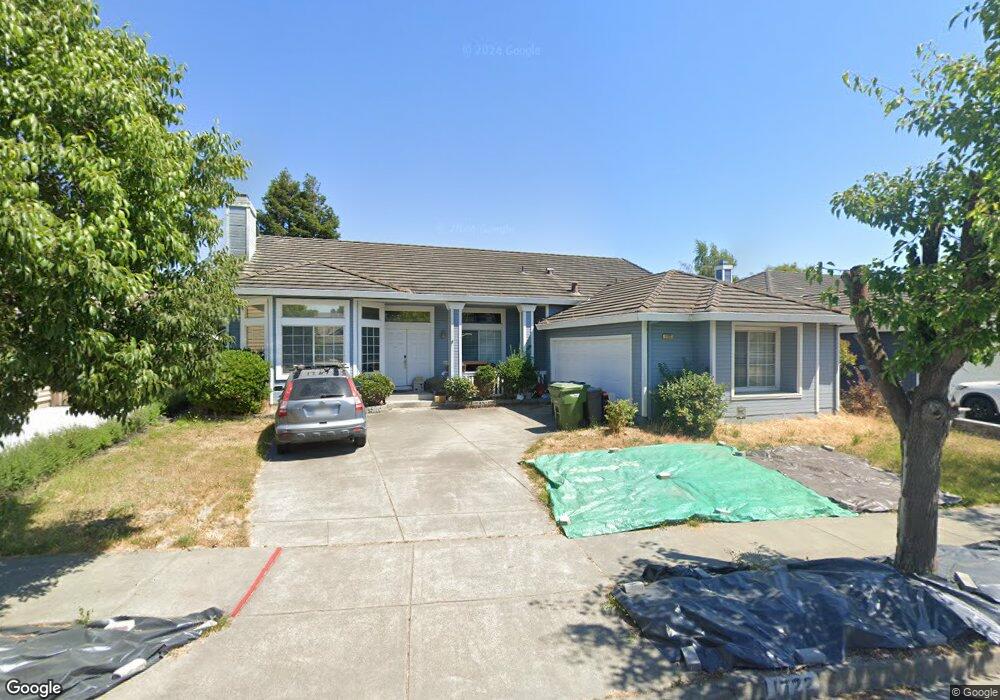
1722 Andover Way Petaluma, CA 94954
College Heights NeighborhoodEstimated Value: $916,743 - $1,073,000
3
Beds
2
Baths
1,769
Sq Ft
$560/Sq Ft
Est. Value
About This Home
This home is located at 1722 Andover Way, Petaluma, CA 94954 and is currently estimated at $990,686, approximately $560 per square foot. 1722 Andover Way is a home located in Sonoma County with nearby schools including Corona Creek Elementary School, Kenilworth Junior High School, and Casa Grande High School.
Ownership History
Date
Name
Owned For
Owner Type
Purchase Details
Closed on
Aug 16, 2016
Sold by
Chu Winzeler Kimberly J and Winzeler Loren D
Bought by
Winzeler Loren D and Chu Winzeler Kimberly J
Current Estimated Value
Purchase Details
Closed on
Sep 21, 2005
Sold by
Cohen Richard David and Cohen Leslie Day
Bought by
Winzeler Loren D and Winzeler Kimberly J Chu
Home Financials for this Owner
Home Financials are based on the most recent Mortgage that was taken out on this home.
Original Mortgage
$548,800
Outstanding Balance
$287,122
Interest Rate
5.5%
Mortgage Type
Fannie Mae Freddie Mac
Estimated Equity
$703,564
Purchase Details
Closed on
Jun 26, 1996
Sold by
Oceanis
Bought by
Cohen Richard and Cohen Leslie Day
Home Financials for this Owner
Home Financials are based on the most recent Mortgage that was taken out on this home.
Original Mortgage
$90,000
Interest Rate
8.01%
Create a Home Valuation Report for This Property
The Home Valuation Report is an in-depth analysis detailing your home's value as well as a comparison with similar homes in the area
Home Values in the Area
Average Home Value in this Area
Purchase History
| Date | Buyer | Sale Price | Title Company |
|---|---|---|---|
| Winzeler Loren D | -- | None Available | |
| Winzeler Loren D | $686,000 | North American Title Co | |
| Cohen Richard | -- | North Bay Title Co |
Source: Public Records
Mortgage History
| Date | Status | Borrower | Loan Amount |
|---|---|---|---|
| Open | Winzeler Loren D | $548,800 | |
| Previous Owner | Cohen Richard | $90,000 |
Source: Public Records
Tax History
| Year | Tax Paid | Tax Assessment Tax Assessment Total Assessment is a certain percentage of the fair market value that is determined by local assessors to be the total taxable value of land and additions on the property. | Land | Improvement |
|---|---|---|---|---|
| 2025 | $10,131 | $937,459 | $491,960 | $445,499 |
| 2024 | $10,131 | $919,078 | $482,314 | $436,764 |
| 2023 | $10,131 | $901,057 | $472,857 | $428,200 |
| 2022 | $9,904 | $883,390 | $463,586 | $419,804 |
| 2021 | $8,675 | $740,000 | $388,000 | $352,000 |
| 2020 | $8,487 | $740,000 | $388,000 | $352,000 |
| 2019 | $8,319 | $720,000 | $378,000 | $342,000 |
| 2018 | $8,774 | $747,000 | $392,000 | $355,000 |
| 2017 | $7,955 | $671,000 | $352,000 | $319,000 |
| 2016 | $7,161 | $607,000 | $319,000 | $288,000 |
| 2015 | $6,370 | $534,000 | $280,000 | $254,000 |
| 2014 | $6,431 | $535,000 | $281,000 | $254,000 |
Source: Public Records
Map
Nearby Homes
- 1757 Burgundy Ct
- 1449 Morning Glory Dr
- 487 Ormsby Ln
- 813 Chardonnay Cir
- 7 Michael Dr
- 570 Sonoma Dr
- 72 Michael Dr
- 6 N Napa Dr
- 93 W Napa Dr
- 57 W Napa Dr
- 125 Saratoga Ct
- 97 Candlewood Dr
- 1610 Northstar Dr
- 1997 Rainier Cir
- 571 Birchwood Dr
- 75 Candlewood Dr
- 717 N Mcdowell Blvd Unit 111
- 148 Oakwood Dr
- 109 Tuxedo Ct
- 1717 Brompton St
- 1718 Andover Way
- 1726 Andover Way
- 1721 Dorset Dr
- 1717 Dorset Dr
- 1714 Andover Way
- 1725 Dorset Dr
- 1730 Andover Way
- 1725 Andover Way
- 1721 Andover Way
- 1713 Dorset Dr
- 1729 Andover Way
- 1729 Dorset Dr
- 1717 Andover Way
- 1710 Andover Way
- 1709 Dorset Dr
- 1733 Andover Way
- 1713 Andover Way
- 1722 Dorset Dr
- 1706 Andover Way
- 1718 Dorset Dr
Your Personal Tour Guide
Ask me questions while you tour the home.