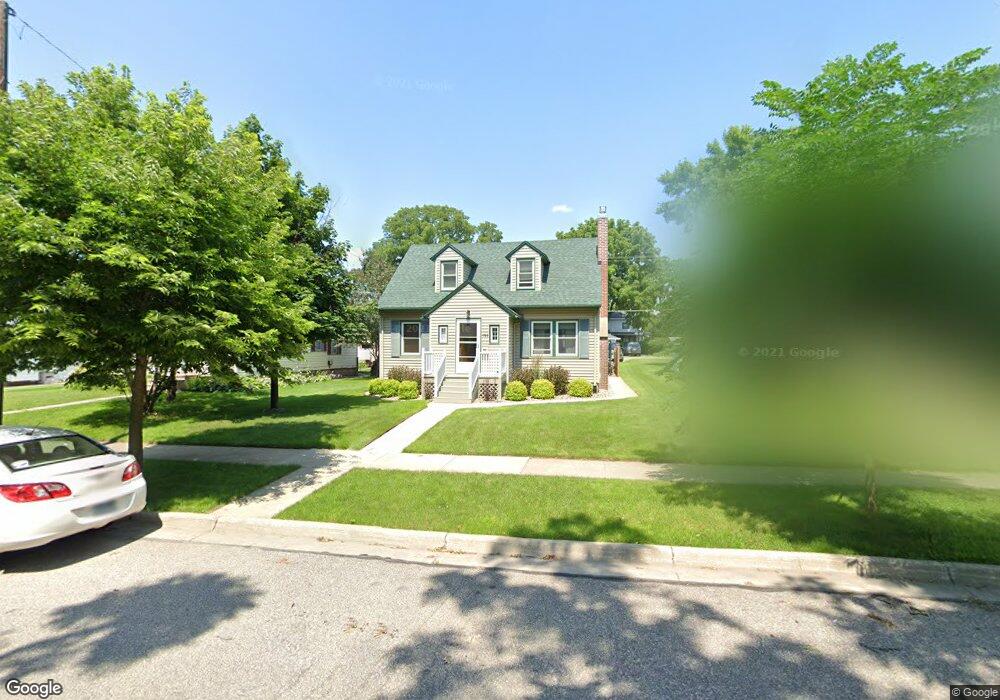
1722 W 6th St Red Wing, MN 55066
Estimated Value: $238,886 - $308,000
4
Beds
3
Baths
1,752
Sq Ft
$155/Sq Ft
Est. Value
About This Home
This home is located at 1722 W 6th St, Red Wing, MN 55066 and is currently estimated at $271,722, approximately $155 per square foot. 1722 W 6th St is a home located in Goodhue County with nearby schools including Sunnyside Elementary School, Burnside Elementary School, and Twin Bluff Middle School.
Ownership History
Date
Name
Owned For
Owner Type
Purchase Details
Closed on
Oct 21, 2024
Sold by
Riegelman David and Riegelman Kristi
Bought by
Riegelman David and Riegelman Kristi
Current Estimated Value
Home Financials for this Owner
Home Financials are based on the most recent Mortgage that was taken out on this home.
Original Mortgage
$64,000
Outstanding Balance
$63,293
Interest Rate
6.09%
Mortgage Type
New Conventional
Estimated Equity
$208,429
Purchase Details
Closed on
Aug 15, 2008
Sold by
Luedtke Ryan and Luedtke Brooke
Bought by
Riegelman David
Purchase Details
Closed on
Jun 24, 2005
Sold by
Karlson Joel M and Karlson Julie A
Bought by
Luedke Ryan
Purchase Details
Closed on
Jun 18, 2001
Sold by
Hesselman Jeffrey and Hesselman Megan
Bought by
Karlson Joel M and Karlson Julie A
Purchase Details
Closed on
Jun 17, 1999
Sold by
Boyer Joseph A
Bought by
Hesselman Jeffrey J
Purchase Details
Closed on
Dec 19, 1997
Sold by
Oeltjen Alan and Oeltjen Kim
Bought by
Boyer Joseph A and Boyer Amy V
Create a Home Valuation Report for This Property
The Home Valuation Report is an in-depth analysis detailing your home's value as well as a comparison with similar homes in the area
Home Values in the Area
Average Home Value in this Area
Purchase History
| Date | Buyer | Sale Price | Title Company |
|---|---|---|---|
| Riegelman David | $500 | None Listed On Document | |
| Riegelman David | $500 | None Listed On Document | |
| Riegelman David | $164,000 | -- | |
| Luedke Ryan | -- | -- | |
| Karlson Joel M | $122,000 | -- | |
| Hesselman Jeffrey J | $91,000 | -- | |
| Boyer Joseph A | $89,000 | -- |
Source: Public Records
Mortgage History
| Date | Status | Borrower | Loan Amount |
|---|---|---|---|
| Open | Riegelman David | $64,000 | |
| Closed | Riegelman David | $64,000 |
Source: Public Records
Tax History
| Year | Tax Paid | Tax Assessment Tax Assessment Total Assessment is a certain percentage of the fair market value that is determined by local assessors to be the total taxable value of land and additions on the property. | Land | Improvement |
|---|---|---|---|---|
| 2025 | $2,484 | $205,400 | $51,000 | $154,400 |
| 2024 | -- | $202,400 | $51,000 | $151,400 |
| 2023 | $2,378 | $192,800 | $51,000 | $141,800 |
| 2022 | $2,216 | $186,600 | $45,900 | $140,700 |
| 2021 | $2,076 | $161,700 | $45,900 | $115,800 |
| 2020 | $2,060 | $154,100 | $45,900 | $108,200 |
| 2019 | $2,100 | $144,200 | $45,900 | $98,300 |
| 2018 | $1,708 | $147,700 | $45,900 | $101,800 |
| 2017 | $1,604 | $131,400 | $45,900 | $85,500 |
| 2016 | $1,508 | $125,700 | $45,900 | $79,800 |
| 2015 | $1,314 | $121,400 | $45,900 | $75,500 |
| 2014 | -- | $117,200 | $45,900 | $71,300 |
Source: Public Records
Map
Nearby Homes
- 1738 W 6th St
- 1715 W 5th St
- 1528 W 6th St
- 717 Blaine St
- 430 Harrison St
- 1227 W 4th St
- 1130 W 4th St
- 1330 Hillside Dr
- 1348 Hillside Dr
- 1004 College Ave
- 1684 Siewert St
- 1050 Sturtevant St
- 815 W 4th St
- 1108 Hawthorne St
- 1020 Hawthorne St
- 617 W 3rd St
- 1606 Reichert Ave
- 1828 Perlich Ave Unit 2G
- 818 Hawthorne St
- 814 Central Ave
- 1722 1722 6th-Street-w
- 1718 W 6th St
- 1732 W 6th St
- 524 Buchanan St
- 1721 W 5th St
- 1727 W 5th St
- 518 Buchanan St
- 1727 1727 5th-Street-w
- 1733 W 5th St
- 1744 W 6th St
- 1719 W 6th St
- 1727 W 6th St
- 1739 W 5th St
- 512 Buchanan St
- 1709 W 6th St
- 1715 W 6th St
- 1737 W 6th St
- 1743 W 5th St
- 504 Buchanan St Unit 506
- 1743 W 6th St
Your Personal Tour Guide
Ask me questions while you tour the home.