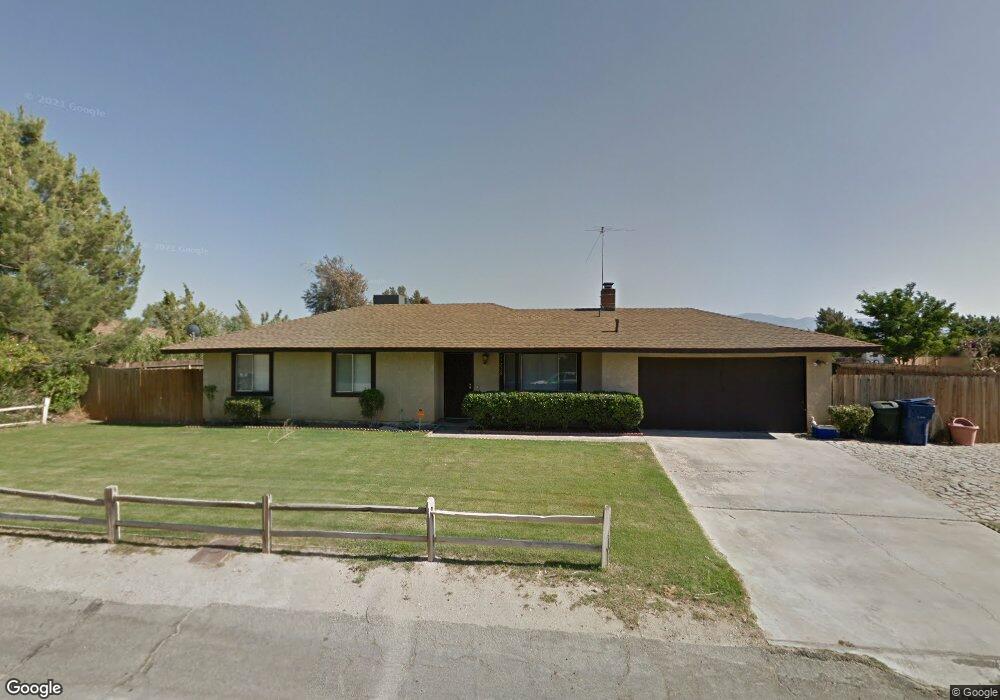
17228 Queensglen Ave Palmdale, CA 93591
Estimated Value: $383,000 - $413,000
3
Beds
2
Baths
1,134
Sq Ft
$348/Sq Ft
Est. Value
About This Home
This home is located at 17228 Queensglen Ave, Palmdale, CA 93591 and is currently estimated at $394,791, approximately $348 per square foot. 17228 Queensglen Ave is a home located in Los Angeles County with nearby schools including Vista San Gabriel Elementary School, Challenger Middle School, and Littlerock High School.
Ownership History
Date
Name
Owned For
Owner Type
Purchase Details
Closed on
Mar 4, 2019
Sold by
Towles Charles
Bought by
Garner Lindsey E and Garner Sylvia E
Current Estimated Value
Purchase Details
Closed on
May 10, 2010
Sold by
Towles Earline
Bought by
Towles Charles
Purchase Details
Closed on
Apr 12, 2010
Sold by
Griffith Steven E and Griffith Victoria Lynn
Bought by
Towles Charles
Purchase Details
Closed on
Apr 3, 2000
Sold by
Hud
Bought by
Griffith Steven E and Griffith Victoria Lynn
Home Financials for this Owner
Home Financials are based on the most recent Mortgage that was taken out on this home.
Original Mortgage
$47,600
Interest Rate
8.24%
Purchase Details
Closed on
Jun 30, 1998
Sold by
Midfirst Bank
Bought by
Hud
Purchase Details
Closed on
Jun 12, 1998
Sold by
Delrosario Jericho Anthony and Delrosario Ginah C
Bought by
Midfirst Bank and Midfirst Bank State Svgs Bank
Create a Home Valuation Report for This Property
The Home Valuation Report is an in-depth analysis detailing your home's value as well as a comparison with similar homes in the area
Home Values in the Area
Average Home Value in this Area
Purchase History
| Date | Buyer | Sale Price | Title Company |
|---|---|---|---|
| Garner Lindsey E | -- | None Available | |
| Towles Charles | -- | Chicago Title Company | |
| Towles Charles | $80,000 | Chicago Title Company | |
| Griffith Steven E | $59,500 | First American Title Co | |
| Hud | -- | United Title Company | |
| Midfirst Bank | $87,116 | United Title Company |
Source: Public Records
Mortgage History
| Date | Status | Borrower | Loan Amount |
|---|---|---|---|
| Previous Owner | Griffith Steven E | $47,600 |
Source: Public Records
Tax History
| Year | Tax Paid | Tax Assessment Tax Assessment Total Assessment is a certain percentage of the fair market value that is determined by local assessors to be the total taxable value of land and additions on the property. | Land | Improvement |
|---|---|---|---|---|
| 2025 | $2,982 | $238,717 | $47,966 | $190,751 |
| 2024 | $2,982 | $234,037 | $47,026 | $187,011 |
| 2023 | $2,941 | $229,449 | $46,104 | $183,345 |
| 2022 | $2,897 | $224,950 | $45,200 | $179,750 |
| 2021 | $2,838 | $220,540 | $44,314 | $176,226 |
| 2020 | $2,771 | $218,280 | $43,860 | $174,420 |
| 2019 | $1,328 | $92,562 | $18,509 | $74,053 |
| 2018 | $1,291 | $90,748 | $18,147 | $72,601 |
| 2016 | $1,210 | $87,227 | $17,444 | $69,783 |
| 2015 | $1,193 | $85,917 | $17,182 | $68,735 |
| 2014 | $1,198 | $84,235 | $16,846 | $67,389 |
Source: Public Records
Map
Nearby Homes
- 17204 Longmeadow Ave
- 17117 Queensglen Ave
- 17322 Longmeadow Ave
- 17307 Longmeadow Ave
- 39646 174th St E
- 0 Unit 25008304
- 0 174th St E
- 10 171st St E
- 0 165ste Vic Ave Unit 24005906
- 0 Tundra Way Vic Desert VI Way Unit 25001076
- 3346 Vac Ave M Vic 225 Ste
- 0 Ave P-8 Unit SR25063825
- 0 Vac Vic Avenue V4 258 Ste Unit CV20246177
- 0 Vac Vic Avenue N10 114 Ste Unit WS25221957
- 0 235th St E Unit SR25130048
- 0 225th St E Unit SR25053430
- 0 Vac Vic Unit SR26010200
- 0 Lake Los Angeles Ave Unit CV26004731
- 0 Lakespring Ave Unit 24006069
- 0 Vac Largo Vista Drt Vic Ave Unit TR26013800
- 17238 Queensglen Ave
- 17227 Queensglen Ave
- 17212 Queensglen Ave
- 17217 Queensglen Ave
- 17301 Queensglen Ave
- 17304 Queensglen Ave
- 17205 Queensglen Ave
- 17305 Queensglen Ave
- 17316 Queensglen Ave
- 17341 Laredo Vista Ave
- 17130 Queensglen Ave
- 17331 Laredo Vista Ave
- 17319 Queensglen Ave
- 17323 Laredo Vista Ave
- 17131 Queensglen Ave
- 17324 Queensglen Ave
- 17304 Longmeadow Ave
- 17301 Laredo Vista Ave
- 17122 Queensglen Ave
- 17363 Laredo Vista Ave