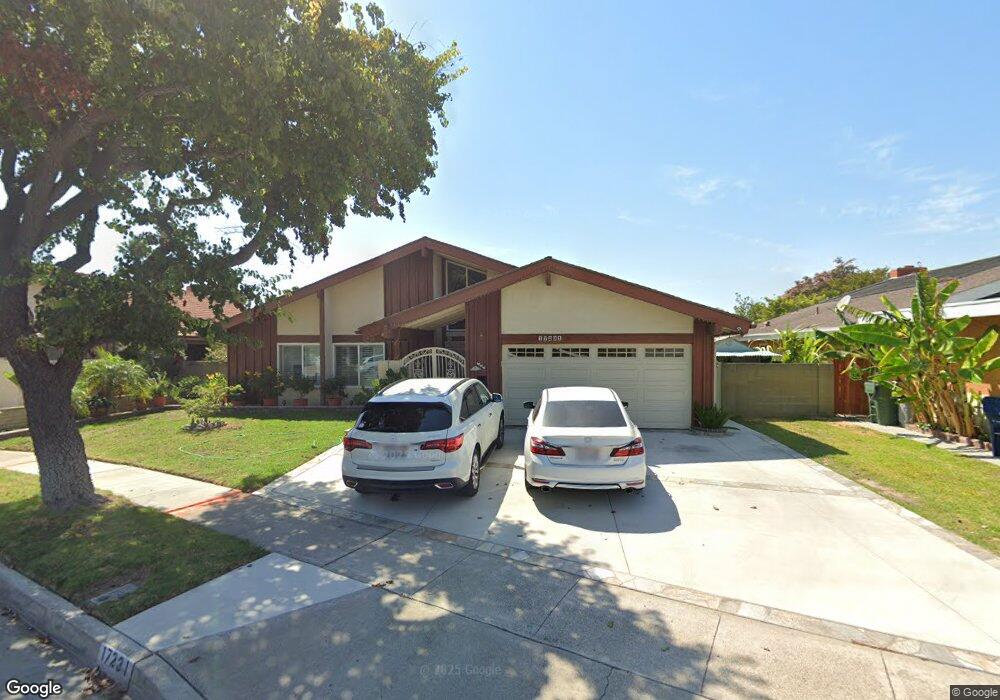
17231 San Ricardo Cir Fountain Valley, CA 92708
Estimated Value: $1,229,000 - $1,336,059
3
Beds
2
Baths
1,527
Sq Ft
$849/Sq Ft
Est. Value
About This Home
This home is located at 17231 San Ricardo Cir, Fountain Valley, CA 92708 and is currently estimated at $1,296,515, approximately $849 per square foot. 17231 San Ricardo Cir is a home located in Orange County with nearby schools including Cox (James H.) Elementary School, Masuda (Kazuo) Middle School, and Fountain Valley High School.
Ownership History
Date
Name
Owned For
Owner Type
Purchase Details
Closed on
Jan 15, 2021
Sold by
Vu Seen Huyminh and Vu Nikki
Bought by
Vu Huy Minh and Vu Nikki
Current Estimated Value
Home Financials for this Owner
Home Financials are based on the most recent Mortgage that was taken out on this home.
Original Mortgage
$325,000
Outstanding Balance
$291,521
Interest Rate
3%
Mortgage Type
New Conventional
Estimated Equity
$1,004,994
Purchase Details
Closed on
Dec 15, 2011
Sold by
Vu Huy Minh and Vu Huy M
Bought by
Vu Huy Minh and Vu Nikki Loan
Purchase Details
Closed on
Sep 28, 2006
Sold by
Walz Joyce L
Bought by
Vu Huy M
Home Financials for this Owner
Home Financials are based on the most recent Mortgage that was taken out on this home.
Original Mortgage
$540,000
Interest Rate
6.39%
Mortgage Type
Purchase Money Mortgage
Purchase Details
Closed on
May 3, 2002
Sold by
Walz Joyce L
Bought by
Walz Joyce L and Joyce L Walz Trust
Create a Home Valuation Report for This Property
The Home Valuation Report is an in-depth analysis detailing your home's value as well as a comparison with similar homes in the area
Home Values in the Area
Average Home Value in this Area
Purchase History
| Date | Buyer | Sale Price | Title Company |
|---|---|---|---|
| Vu Huy Minh | -- | Bnt Title Company Of Ca | |
| Vu Huy Minh | -- | None Available | |
| Vu Huy Minh | -- | None Available | |
| Vu Huy M | $675,000 | Lawyers Title | |
| Walz Joyce L | -- | -- |
Source: Public Records
Mortgage History
| Date | Status | Borrower | Loan Amount |
|---|---|---|---|
| Open | Vu Huy Minh | $325,000 | |
| Closed | Vu Huy M | $540,000 |
Source: Public Records
Tax History Compared to Growth
Tax History
| Year | Tax Paid | Tax Assessment Tax Assessment Total Assessment is a certain percentage of the fair market value that is determined by local assessors to be the total taxable value of land and additions on the property. | Land | Improvement |
|---|---|---|---|---|
| 2025 | $9,947 | $904,349 | $753,153 | $151,196 |
| 2024 | $9,947 | $886,617 | $738,385 | $148,232 |
| 2023 | $9,716 | $869,233 | $723,907 | $145,326 |
| 2022 | $9,578 | $852,190 | $709,713 | $142,477 |
| 2021 | $9,393 | $835,481 | $695,797 | $139,684 |
| 2020 | $9,088 | $803,760 | $675,159 | $128,601 |
| 2019 | $8,900 | $788,000 | $661,920 | $126,080 |
| 2018 | $8,896 | $788,000 | $661,920 | $126,080 |
| 2017 | $8,206 | $722,000 | $609,142 | $112,858 |
| 2016 | $7,480 | $673,000 | $560,142 | $112,858 |
| 2015 | $7,474 | $673,000 | $560,142 | $112,858 |
| 2014 | $6,822 | $612,144 | $499,286 | $112,858 |
Source: Public Records
Map
Nearby Homes
- 10452 Circulo de Juarez
- 17071 Ward St
- 10322 Avenida Cinco de Mayo
- 17077 Los Modelos St
- 18021 Roch Ct
- 18016 Roch Ct
- 17288 San Lorenzo Cir
- 17210 San Mateo St Unit 25
- 17401 Hood Ct
- 10430 La Cebra Ave
- 10900 La Flor Ave
- 17333 Brookhurst St Unit D6
- 17333 Brookhurst St Unit B7
- 11356 Stonecress Ave
- 17168 Newhope St Unit 222
- 11620 Warner Ave Unit 624
- 17215 Buttonwood St
- 16767 Madrone Cir
- 17200 Newhope St Unit 109
- 17200 Newhope St Unit 217
- 17219 San Ricardo Cir
- 17245 San Ricardo Cir
- 10568 Flying Fish Cir
- 17207 San Ricardo Cir
- 10556 Flying Fish Cir
- 17234 San Ricardo Cir
- 10567 Flying Fish Cir
- 17195 San Ricardo St
- 17246 San Ricardo Cir
- 17222 San Ricardo Cir
- 10544 Flying Fish Cir
- 17210 San Ricardo Cir
- 10555 Flying Fish Cir
- 17183 San Ricardo St
- 17198 San Ricardo St
- 10543 Flying Fish Cir
- 10532 Flying Fish Cir
- 17247 Reimer St
- 17255 Reimer St
- 17237 Reimer St