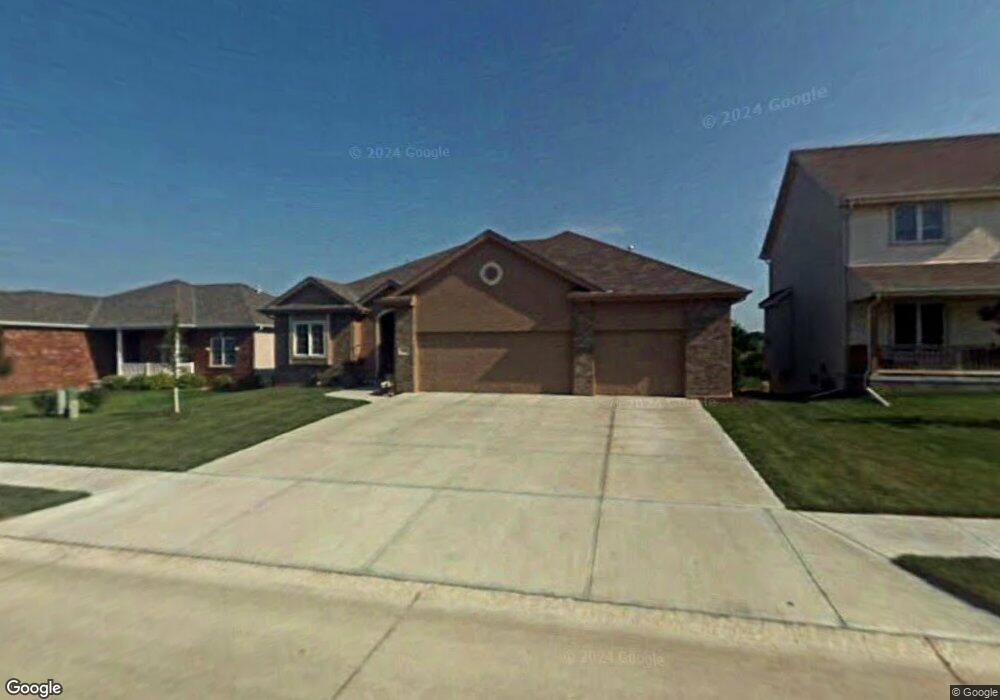
17235 South Creek Cir Omaha, NE 68136
Southwest Omaha NeighborhoodEstimated Value: $354,582 - $400,000
2
Beds
2
Baths
1,550
Sq Ft
$243/Sq Ft
Est. Value
About This Home
This home is located at 17235 South Creek Cir, Omaha, NE 68136 and is currently estimated at $375,896, approximately $242 per square foot. 17235 South Creek Cir is a home located in Sarpy County with nearby schools including Palisades Elementary School, Gretna Middle School, and Gretna High School.
Ownership History
Date
Name
Owned For
Owner Type
Purchase Details
Closed on
Jul 21, 2020
Sold by
Greenway Thomas S and Greenway Shannon M
Bought by
Greenway Thomas S and Greenway Shannon M
Current Estimated Value
Purchase Details
Closed on
May 15, 2014
Sold by
Greenway Thomas S and Greenway Shannon M
Bought by
Greenway Thomas S and Greenway Shannon L
Purchase Details
Closed on
Aug 30, 2007
Sold by
Home Building Consultants Inc
Bought by
Greenway Tom S and Greenway Shannon M
Home Financials for this Owner
Home Financials are based on the most recent Mortgage that was taken out on this home.
Original Mortgage
$170,000
Outstanding Balance
$108,457
Interest Rate
6.72%
Estimated Equity
$267,439
Purchase Details
Closed on
Mar 2, 2007
Sold by
Cz Developments Llc
Bought by
Hbc Inc
Create a Home Valuation Report for This Property
The Home Valuation Report is an in-depth analysis detailing your home's value as well as a comparison with similar homes in the area
Home Values in the Area
Average Home Value in this Area
Purchase History
| Date | Buyer | Sale Price | Title Company |
|---|---|---|---|
| Greenway Thomas S | -- | None Available | |
| Greenway Thomas S | -- | None Available | |
| Greenway Tom S | $229,000 | Superior Title & Escrow Llc | |
| Hbc Inc | $25,000 | Nlta |
Source: Public Records
Mortgage History
| Date | Status | Borrower | Loan Amount |
|---|---|---|---|
| Open | Greenway Tom S | $170,000 |
Source: Public Records
Tax History Compared to Growth
Tax History
| Year | Tax Paid | Tax Assessment Tax Assessment Total Assessment is a certain percentage of the fair market value that is determined by local assessors to be the total taxable value of land and additions on the property. | Land | Improvement |
|---|---|---|---|---|
| 2025 | $6,228 | $319,713 | $60,000 | $259,713 |
| 2024 | $7,216 | $306,600 | $59,000 | $247,600 |
| 2023 | $7,216 | $299,344 | $51,000 | $248,344 |
| 2022 | $6,635 | $267,551 | $47,000 | $220,551 |
| 2021 | $6,101 | $246,797 | $45,000 | $201,797 |
| 2020 | $6,076 | $245,909 | $40,000 | $205,909 |
| 2019 | $6,163 | $240,219 | $40,000 | $200,219 |
| 2018 | $5,669 | $217,766 | $35,000 | $182,766 |
| 2017 | $5,636 | $217,790 | $30,000 | $187,790 |
| 2016 | $5,626 | $218,280 | $30,000 | $188,280 |
| 2015 | $5,788 | $217,424 | $25,000 | $192,424 |
| 2014 | $5,672 | $215,333 | $25,000 | $190,333 |
| 2012 | -- | $208,753 | $25,000 | $183,753 |
Source: Public Records
Map
Nearby Homes
- 7820 S 173rd St
- 16904 Joanne Dr
- 7705 S 169th St
- 7501 S 170th St
- 17511 Greenleaf St
- 17523 Greenleaf St
- 17514 Robin Dr
- 17522 Robin Dr
- 17526 Robin Dr
- 7404 S 169th St
- 17538 Robin Dr
- 8308 S 175th St
- Fairfield Plan at Mirabel
- Abbott Plan at Mirabel
- Edmon Plan at Mirabel
- Holland Plan at Mirabel
- Harmony Plan at Mirabel
- Neuville Plan at Mirabel
- 17607 Greenleaf St
- 17608 Robin Dr
- 17235 South Creek Cir
- 17231 South Creek Cir
- 17239 S Creek Cir
- 17239 S Creek Cr
- 17239 South Creek Cir
- 17231 S Creek Cir
- 17307 S Creek Cir
- 17227 S Creek Cir
- 17227 South Creek Cir
- 17236 S Creek Cir
- 17236 S Creek Cr
- 17236 South Creek Cir
- 17240 S Creek Cir
- 17240 S Creek Cr
- 17240 South Creek Cir
- 17232 S Creek Cir
- 17232 S Creek Cr
- 17232 South Creek Cir
- 17311 S Creek Cir
- 17306 S Creek Cir