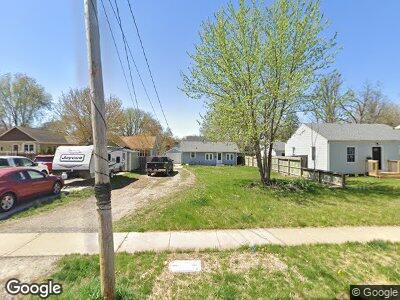
1724 46th St Des Moines, IA 50310
Waveland Park NeighborhoodEstimated Value: $131,000 - $153,492
2
Beds
1
Bath
620
Sq Ft
$224/Sq Ft
Est. Value
About This Home
This home is located at 1724 46th St, Des Moines, IA 50310 and is currently estimated at $139,123, approximately $224 per square foot. 1724 46th St is a home located in Polk County with nearby schools including Perkins Elementary School, Merrill Middle School, and Roosevelt High School.
Ownership History
Date
Name
Owned For
Owner Type
Purchase Details
Closed on
Aug 1, 2018
Sold by
Hesto Properties Llc
Bought by
Lyons Chelsie
Current Estimated Value
Home Financials for this Owner
Home Financials are based on the most recent Mortgage that was taken out on this home.
Original Mortgage
$78,000
Outstanding Balance
$71,394
Interest Rate
6.7%
Estimated Equity
$68,709
Purchase Details
Closed on
May 13, 2014
Sold by
Miner Martin J and Miner Lenore Raynell
Bought by
Hesto Properties Llc
Purchase Details
Closed on
Aug 11, 1999
Sold by
Estate Of Gary L Losee
Bought by
Miner Martin J
Create a Home Valuation Report for This Property
The Home Valuation Report is an in-depth analysis detailing your home's value as well as a comparison with similar homes in the area
Home Values in the Area
Average Home Value in this Area
Purchase History
| Date | Buyer | Sale Price | Title Company |
|---|---|---|---|
| Lyons Chelsie | $84,500 | None Available | |
| Hesto Properties Llc | -- | None Available | |
| Miner Martin J | $36,000 | -- |
Source: Public Records
Mortgage History
| Date | Status | Borrower | Loan Amount |
|---|---|---|---|
| Open | Lyons Chelsie | $78,000 |
Source: Public Records
Tax History Compared to Growth
Tax History
| Year | Tax Paid | Tax Assessment Tax Assessment Total Assessment is a certain percentage of the fair market value that is determined by local assessors to be the total taxable value of land and additions on the property. | Land | Improvement |
|---|---|---|---|---|
| 2024 | $2,124 | $108,000 | $43,500 | $64,500 |
| 2023 | $2,214 | $108,000 | $43,500 | $64,500 |
| 2022 | $2,196 | $93,900 | $38,500 | $55,400 |
| 2021 | $2,128 | $93,900 | $38,500 | $55,400 |
| 2020 | $2,212 | $85,300 | $35,100 | $50,200 |
| 2019 | $2,230 | $85,300 | $35,100 | $50,200 |
| 2018 | $2,762 | $75,200 | $30,700 | $44,500 |
| 2017 | $1,826 | $75,200 | $30,700 | $44,500 |
| 2016 | $1,778 | $67,500 | $27,500 | $40,000 |
| 2015 | $1,778 | $67,500 | $27,500 | $40,000 |
| 2014 | $1,642 | $61,800 | $25,100 | $36,700 |
Source: Public Records
Map
Nearby Homes