Estimated Value: $190,000 - $246,538
2
Beds
1
Bath
780
Sq Ft
$267/Sq Ft
Est. Value
About This Home
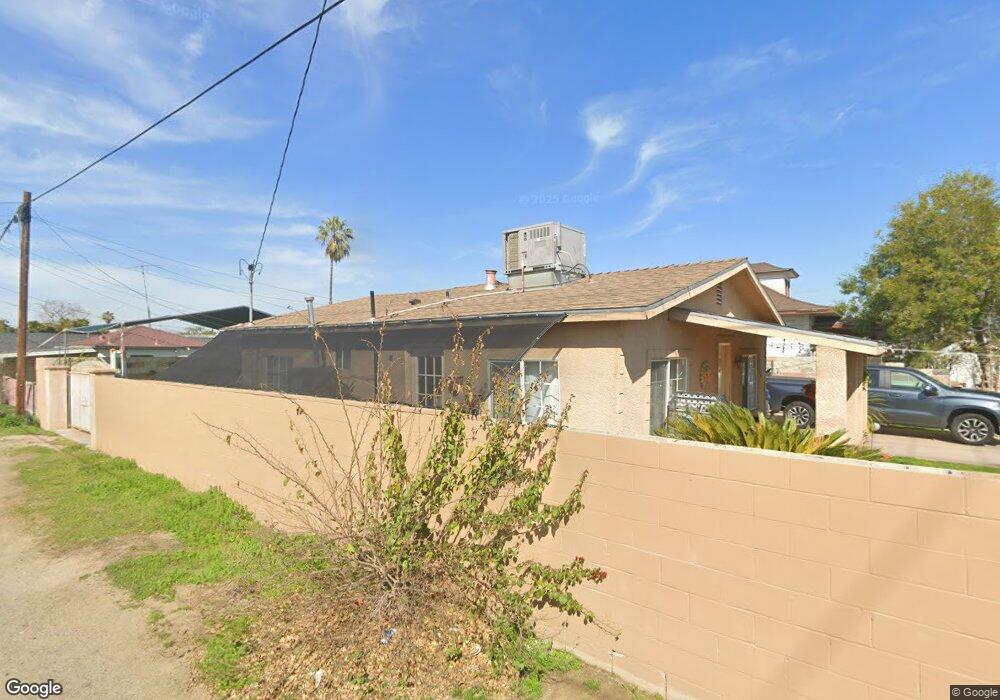
This home is located at 1725 1st St, Selma, CA 93662 and is currently estimated at $208,385, approximately $267 per square foot. 1725 1st St is a home located in Fresno County with nearby schools including James Garfield Elementary School, Abraham Lincoln Middle School, and Selma High School.
Ownership History
Date
Name
Owned For
Owner Type
Purchase Details
Closed on
Jun 15, 2022
Sold by
Rubio Montes Raul
Bought by
Lopez Samuel Rubio
Current Estimated Value
Purchase Details
Closed on
Sep 17, 2007
Sold by
Rubio Raul and Rubio Josefina
Bought by
Montes Raul Rubio
Purchase Details
Closed on
Jun 8, 2007
Sold by
Rubino Raul and Rubio Josefina
Bought by
Rubio Raul and Rubio Josefina
Purchase Details
Closed on
Mar 22, 2005
Sold by
Perales Mary
Bought by
Rubio Raul and Rubio Josefina
Home Financials for this Owner
Home Financials are based on the most recent Mortgage that was taken out on this home.
Original Mortgage
$52,500
Interest Rate
5.84%
Mortgage Type
Seller Take Back
Create a Home Valuation Report for This Property
The Home Valuation Report is an in-depth analysis detailing your home's value as well as a comparison with similar homes in the area
Home Values in the Area
Average Home Value in this Area
Purchase History
| Date | Buyer | Sale Price | Title Company |
|---|---|---|---|
| Lopez Samuel Rubio | -- | None Listed On Document | |
| Montes Raul Rubio | -- | None Available | |
| Rubio Raul | -- | None Available | |
| Rubio Raul | $105,000 | Chicago Title Company |
Source: Public Records
Mortgage History
| Date | Status | Borrower | Loan Amount |
|---|---|---|---|
| Previous Owner | Rubio Raul | $52,500 |
Source: Public Records
Tax History Compared to Growth
Tax History
| Year | Tax Paid | Tax Assessment Tax Assessment Total Assessment is a certain percentage of the fair market value that is determined by local assessors to be the total taxable value of land and additions on the property. | Land | Improvement |
|---|---|---|---|---|
| 2025 | $2,992 | $175,098 | $58,366 | $116,732 |
| 2023 | $2,547 | $168,300 | $56,100 | $112,200 |
| 2022 | $2,509 | $141,982 | $34,143 | $107,839 |
| 2021 | $1,496 | $50,500 | $30,300 | $20,200 |
| 2020 | $1,468 | $50,000 | $30,000 | $20,000 |
| 2019 | $1,347 | $43,000 | $25,000 | $18,000 |
| 2018 | $2,003 | $102,000 | $30,600 | $71,400 |
| 2017 | $1,925 | $100,000 | $30,000 | $70,000 |
| 2016 | $1,609 | $85,000 | $30,000 | $55,000 |
| 2015 | $1,641 | $85,000 | $30,000 | $55,000 |
| 2014 | $1,470 | $72,500 | $17,400 | $55,100 |
Source: Public Records
Map
Nearby Homes