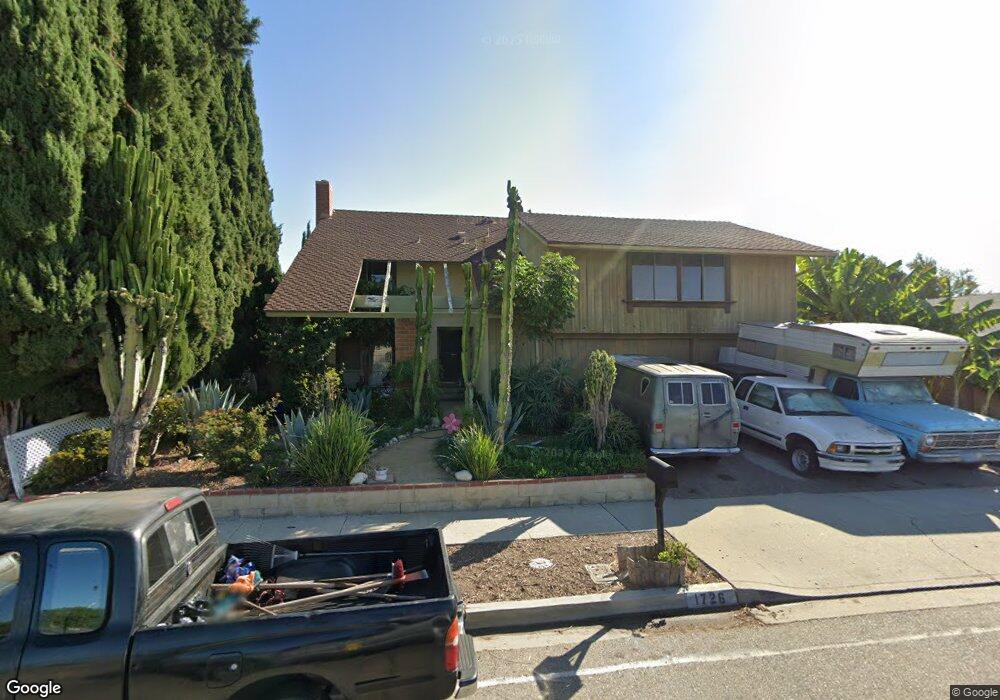
1726 Bridget Ave Simi Valley, CA 93065
Central Simi Valley NeighborhoodEstimated Value: $829,914 - $897,000
4
Beds
3
Baths
2,695
Sq Ft
$320/Sq Ft
Est. Value
About This Home
This home is located at 1726 Bridget Ave, Simi Valley, CA 93065 and is currently estimated at $862,979, approximately $320 per square foot. 1726 Bridget Ave is a home located in Ventura County with nearby schools including Berylwood Elementary School, Hillside Middle School, and Royal High School.
Ownership History
Date
Name
Owned For
Owner Type
Purchase Details
Closed on
Oct 24, 2005
Sold by
Reyes Edward
Bought by
Reyes Edward
Current Estimated Value
Purchase Details
Closed on
Jul 10, 2002
Sold by
Reyes Edward
Bought by
Reyes Edward
Home Financials for this Owner
Home Financials are based on the most recent Mortgage that was taken out on this home.
Original Mortgage
$51,500
Interest Rate
6.15%
Purchase Details
Closed on
Feb 10, 1997
Sold by
Edward Reyes
Bought by
Reyes Edward
Create a Home Valuation Report for This Property
The Home Valuation Report is an in-depth analysis detailing your home's value as well as a comparison with similar homes in the area
Home Values in the Area
Average Home Value in this Area
Purchase History
| Date | Buyer | Sale Price | Title Company |
|---|---|---|---|
| Reyes Edward | -- | -- | |
| Reyes Edward | -- | Old Republic Title Ins Compa | |
| Reyes Edward | -- | -- |
Source: Public Records
Mortgage History
| Date | Status | Borrower | Loan Amount |
|---|---|---|---|
| Closed | Reyes Edward | $51,500 |
Source: Public Records
Tax History
| Year | Tax Paid | Tax Assessment Tax Assessment Total Assessment is a certain percentage of the fair market value that is determined by local assessors to be the total taxable value of land and additions on the property. | Land | Improvement |
|---|---|---|---|---|
| 2025 | $2,486 | $166,351 | $41,565 | $124,786 |
| 2024 | $2,486 | $163,090 | $40,750 | $122,340 |
| 2023 | $2,333 | $159,893 | $39,951 | $119,942 |
| 2022 | $2,293 | $156,758 | $39,167 | $117,591 |
| 2021 | $2,248 | $153,685 | $38,399 | $115,286 |
| 2020 | $2,182 | $152,110 | $38,006 | $114,104 |
| 2019 | $2,078 | $149,128 | $37,261 | $111,867 |
| 2018 | $2,041 | $146,205 | $36,531 | $109,674 |
| 2017 | $1,981 | $143,339 | $35,815 | $107,524 |
| 2016 | $1,885 | $140,529 | $35,113 | $105,416 |
| 2015 | $1,830 | $138,421 | $34,587 | $103,834 |
| 2014 | $1,786 | $135,711 | $33,910 | $101,801 |
Source: Public Records
Map
Nearby Homes
- 1843 Garvin Ave
- 2399 Lee St
- 2405 Lee St
- 2267 Morley St
- 2407 Elizondo Ave
- 1558 Ysrella Ave
- 1387 Cherry Ave
- 2165 Malcolm St
- 2095 Morley St
- 2783 Fallon Cir
- 2371 Larch St
- 2146 N Brower St
- 2820 Rock St
- 1904 Heywood St Unit L
- 2915 Deacon St Unit 17
- 1932 Heywood St Unit B
- 1750 Pope Ave
- 2235 Clover St
- 2325 Wisteria St
- 2025 Royal Ave
Your Personal Tour Guide
Ask me questions while you tour the home.