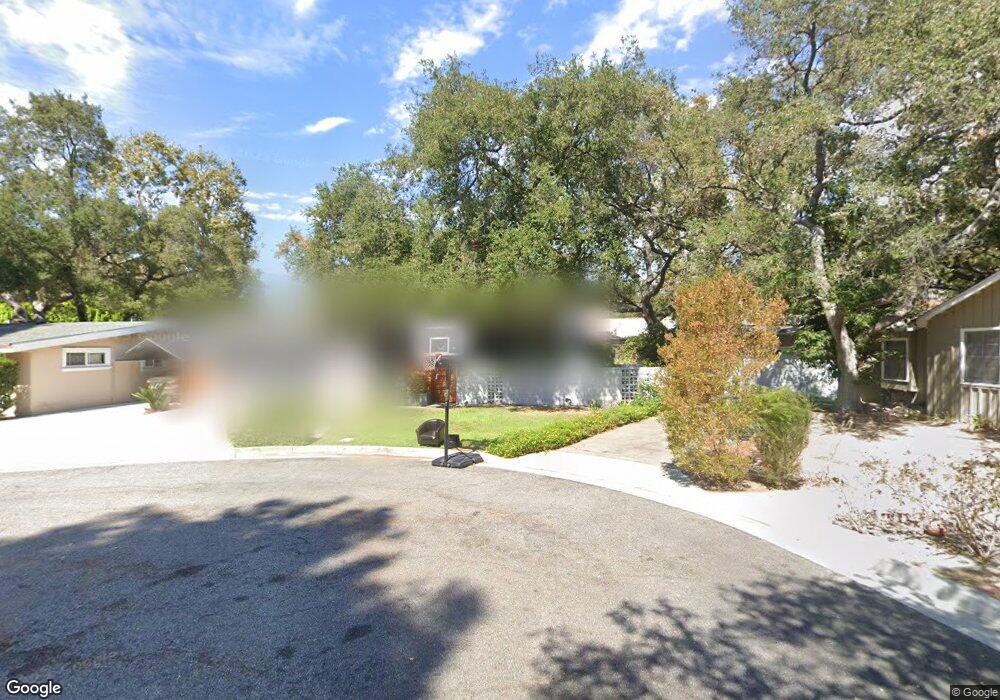
1727 Capistrano Cir Glendale, CA 91208
Verdugo Woodlands NeighborhoodEstimated Value: $1,592,583 - $1,918,000
3
Beds
2
Baths
2,115
Sq Ft
$833/Sq Ft
Est. Value
About This Home
This home is located at 1727 Capistrano Cir, Glendale, CA 91208 and is currently estimated at $1,760,896, approximately $832 per square foot. 1727 Capistrano Cir is a home located in Los Angeles County with nearby schools including Verdugo Woodlands Elementary School, Woodrow Wilson Middle School, and Glendale High School.
Ownership History
Date
Name
Owned For
Owner Type
Purchase Details
Closed on
Sep 16, 2016
Sold by
Mesa Martin and Mesa Celena
Bought by
Mesa Martin and Mesa Celena Cruz
Current Estimated Value
Home Financials for this Owner
Home Financials are based on the most recent Mortgage that was taken out on this home.
Original Mortgage
$659,000
Outstanding Balance
$526,722
Interest Rate
3.45%
Mortgage Type
New Conventional
Estimated Equity
$1,234,174
Purchase Details
Closed on
Apr 18, 2014
Sold by
Wilson Phillip R and Wilson Living Trust
Bought by
Mesa Martin and Mesa Celena
Home Financials for this Owner
Home Financials are based on the most recent Mortgage that was taken out on this home.
Original Mortgage
$680,000
Interest Rate
3.37%
Mortgage Type
Adjustable Rate Mortgage/ARM
Purchase Details
Closed on
May 17, 1999
Sold by
Wilkening Gregory P and Wilkening Heidi M
Bought by
Wilson Austin R and Wilson Valerie P
Create a Home Valuation Report for This Property
The Home Valuation Report is an in-depth analysis detailing your home's value as well as a comparison with similar homes in the area
Home Values in the Area
Average Home Value in this Area
Purchase History
| Date | Buyer | Sale Price | Title Company |
|---|---|---|---|
| Mesa Martin | -- | First American Title Company | |
| Mesa Martin | $850,000 | Chicago Title Co | |
| Wilson Austin R | $445,000 | Old Republic Title Company |
Source: Public Records
Mortgage History
| Date | Status | Borrower | Loan Amount |
|---|---|---|---|
| Open | Mesa Martin | $659,000 | |
| Closed | Mesa Martin | $680,000 |
Source: Public Records
Tax History Compared to Growth
Tax History
| Year | Tax Paid | Tax Assessment Tax Assessment Total Assessment is a certain percentage of the fair market value that is determined by local assessors to be the total taxable value of land and additions on the property. | Land | Improvement |
|---|---|---|---|---|
| 2025 | $11,361 | $1,041,972 | $713,569 | $328,403 |
| 2024 | $11,361 | $1,021,542 | $699,578 | $321,964 |
| 2023 | $11,102 | $1,001,512 | $685,861 | $315,651 |
| 2022 | $10,909 | $981,875 | $672,413 | $309,462 |
| 2021 | $10,715 | $962,624 | $659,229 | $303,395 |
| 2019 | $10,304 | $934,075 | $639,677 | $294,398 |
| 2018 | $10,135 | $915,761 | $627,135 | $288,626 |
| 2016 | $9,672 | $880,203 | $602,784 | $277,419 |
| 2015 | $9,474 | $866,982 | $593,730 | $273,252 |
| 2014 | $1,854 | $162,810 | $47,163 | $115,647 |
Source: Public Records
Map
Nearby Homes
- 1765 Fern Ln
- 0 Pasa Glen Dr Unit 25533579
- 1 Pasa Glen Dr
- 1750 Wabasso Way
- 2450 Hermosita Dr
- 182 Emburns Dr
- 192 Emburns Dr
- 2 Emburns Dr
- 2707 Hermosita Dr
- 0 Emburns Unit 25533591
- 1817 Los Encinos Ave
- 1438 Hillside Dr
- 1824 Crestmont Ct
- 2940 N Verdugo Rd Unit 411
- 2940 N Verdugo Rd Unit 409
- 1335 Opechee Way
- 0 Bayberry Dr Unit 25567317
- 1935 Alpha Rd Unit 112
- 1935 Alpha Rd Unit 337
- 1935 Alpha Rd Unit 310
- 1731 Capistrano Cir
- 1721 Capistrano Cir
- 2415 Sylvan Ln
- 2425 Sylvan Ln
- 2405 Sylvan Ln
- 1717 Capistrano Cir
- 1730 Capistrano Cir
- 2429 Sylvan Ln
- 1728 Capistrano Cir
- 1724 Capistrano Cir
- 2337 Sylvan Ln
- 1730 El Rito Ave
- 1720 Capistrano Cir
- 1711 Capistrano Cir
- 1726 El Rito Ave
- 1734 El Rito Ave
- 2433 Sylvan Ln
- 2416 Sylvan Ln
- 2408 Sylvan Ln
- 2404 Sylvan Ln