1727 Leavenworth St Unit 1729 San Francisco, CA 94109
Russian Hill NeighborhoodEstimated Value: $1,578,000 - $1,802,000
--
Bed
2
Baths
2,320
Sq Ft
$734/Sq Ft
Est. Value
About This Home
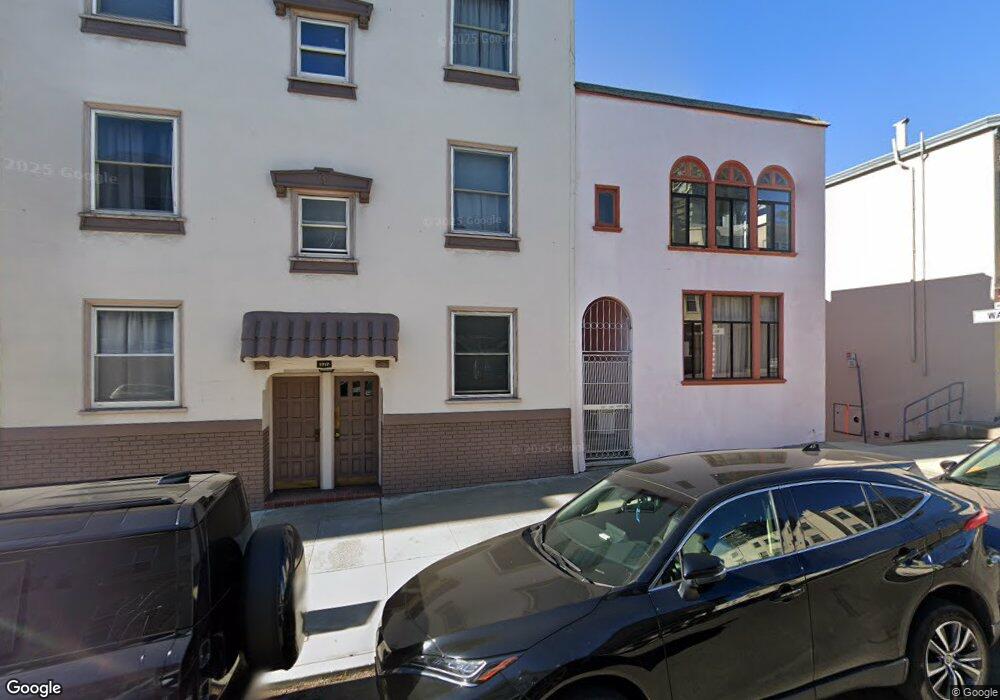
This home is located at 1727 Leavenworth St Unit 1729, San Francisco, CA 94109 and is currently estimated at $1,702,600, approximately $733 per square foot. 1727 Leavenworth St Unit 1729 is a home located in San Francisco County with nearby schools including Yick Wo Elementary School, Francisco Middle School, and Cathedral School for Boys.
Ownership History
Date
Name
Owned For
Owner Type
Purchase Details
Closed on
Aug 21, 2024
Sold by
Larry Tom Revocable Trust and Tom Richard L
Bought by
Dwyer Neil and Diver Jack
Current Estimated Value
Home Financials for this Owner
Home Financials are based on the most recent Mortgage that was taken out on this home.
Original Mortgage
$1,308,000
Outstanding Balance
$1,292,913
Interest Rate
6.77%
Mortgage Type
New Conventional
Estimated Equity
$409,687
Purchase Details
Closed on
Nov 29, 2021
Sold by
Larry Tom
Bought by
Larry Tom Revocable Trust
Purchase Details
Closed on
Feb 17, 2021
Sold by
Tom James
Bought by
Tom Larry
Purchase Details
Closed on
Oct 20, 2020
Sold by
Tom Richard L and 1992 Wallace S
Bought by
Tom Richard L and Tom James
Create a Home Valuation Report for This Property
The Home Valuation Report is an in-depth analysis detailing your home's value as well as a comparison with similar homes in the area
Home Values in the Area
Average Home Value in this Area
Purchase History
| Date | Buyer | Sale Price | Title Company |
|---|---|---|---|
| Dwyer Neil | -- | Chicago Title | |
| Larry Tom Revocable Trust | -- | Smith Marissa C | |
| Tom Larry | $237,500 | None Available | |
| Tom Larry | $237,500 | None Available | |
| Tom Larry | $475,000 | None Available | |
| Tom Richard L | -- | None Available |
Source: Public Records
Mortgage History
| Date | Status | Borrower | Loan Amount |
|---|---|---|---|
| Open | Dwyer Neil | $1,308,000 |
Source: Public Records
Tax History Compared to Growth
Tax History
| Year | Tax Paid | Tax Assessment Tax Assessment Total Assessment is a certain percentage of the fair market value that is determined by local assessors to be the total taxable value of land and additions on the property. | Land | Improvement |
|---|---|---|---|---|
| 2025 | $13,502 | $1,635,000 | $1,144,500 | $490,500 |
| 2024 | $13,502 | $1,085,223 | $739,198 | $346,025 |
| 2023 | $13,296 | $1,063,946 | $724,705 | $339,241 |
| 2022 | $13,038 | $1,043,086 | $710,496 | $332,590 |
| 2021 | $2,430 | $145,183 | $63,091 | $82,092 |
| 2020 | $1,800 | $143,780 | $62,484 | $81,296 |
| 2019 | $1,742 | $140,962 | $61,260 | $79,702 |
| 2018 | $1,682 | $138,200 | $60,060 | $78,140 |
| 2017 | $1,662 | $135,492 | $58,884 | $76,608 |
| 2016 | $1,603 | $132,836 | $57,730 | $75,106 |
| 2015 | $1,581 | $130,842 | $56,864 | $73,978 |
| 2014 | $1,539 | $128,282 | $55,752 | $72,530 |
Source: Public Records
Map
Nearby Homes
- 1250 Vallejo St Unit 7
- 1250 Vallejo St Unit 9
- 1176 Broadway
- 1135 Green St
- 1145 Green St Unit 3
- 1101 Green St Unit 1801
- 1725 Hyde St Unit 1
- 44 Lynch St
- 164 Bernard St
- 1725 Jones St Unit 3
- 74 Lynch St
- 68 Lynch St
- 1070 Green St Unit 801
- 1925 Leavenworth St Unit 7
- 16 Delgado Place
- 1601 Hyde St
- 999 Green St Unit 1501
- 999 Green St Unit 2001
- 1100 Union St Unit 1100
- 1100 Union St Unit 1000
- 1727-1729 Leavenworth St
- 1737 Leavenworth St Unit 1739
- 1220 Broadway Unit 1222
- 1226 Broadway
- 1745 Leavenworth St
- 1701 Leavenworth St
- 1751 Leavenworth St
- 87 Glover St
- 1740 Leavenworth St Unit 1742
- 1732 Leavenworth St
- 1217 Vallejo St
- 1761 Leavenworth St
- 1734 Leavenworth St Unit 1736
- 1240 Broadway Unit 1244
- 1221 Vallejo St
- 1229 Vallejo St Unit 1233
- 1196 Broadway Unit . 10
- 1196 Broadway
- 1196 Broadway Unit 3
- 1196 Broadway Unit 1