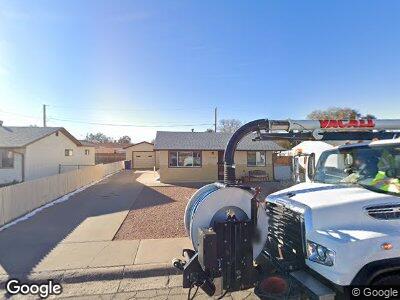
1727 Moore Ave Pueblo, CO 81005
Beulah Heights NeighborhoodEstimated Value: $201,000 - $218,000
2
Beds
3
Baths
1,007
Sq Ft
$209/Sq Ft
Est. Value
About This Home
This home is located at 1727 Moore Ave, Pueblo, CO 81005 and is currently estimated at $210,469, approximately $209 per square foot. 1727 Moore Ave is a home located in Pueblo County with nearby schools including Columbian Elementary School, Roncalli STEM Academy, and South High School.
Ownership History
Date
Name
Owned For
Owner Type
Purchase Details
Closed on
Oct 29, 2012
Sold by
Lobato David and Lobato Arthur
Bought by
Gurule Mary P
Current Estimated Value
Home Financials for this Owner
Home Financials are based on the most recent Mortgage that was taken out on this home.
Original Mortgage
$67,258
Interest Rate
3.5%
Mortgage Type
FHA
Purchase Details
Closed on
Jul 13, 2007
Sold by
Lobato John B and Lobato John
Bought by
Lobato John B and Lobato David
Purchase Details
Closed on
Oct 17, 2001
Bought by
Lobato John B
Purchase Details
Closed on
Jul 7, 1999
Sold by
Lobato John B + S Louise Tr
Bought by
Lobato John B + S Louise
Purchase Details
Closed on
Mar 30, 1999
Sold by
Lobato John B + S Louise
Bought by
Lobato John B + S Louise Tr
Purchase Details
Closed on
Sep 8, 1975
Sold by
Baca Jerald R + Lynne A
Bought by
Kochman Louise
Create a Home Valuation Report for This Property
The Home Valuation Report is an in-depth analysis detailing your home's value as well as a comparison with similar homes in the area
Home Values in the Area
Average Home Value in this Area
Purchase History
| Date | Buyer | Sale Price | Title Company |
|---|---|---|---|
| Gurule Mary P | $68,500 | Stewart Title | |
| Lobato John B | -- | None Available | |
| Lobato John B | -- | -- | |
| Lobato John B + S Louise | -- | -- | |
| Lobato John B + S Louise Tr | -- | -- | |
| Kochman Louise | $23,000 | -- |
Source: Public Records
Mortgage History
| Date | Status | Borrower | Loan Amount |
|---|---|---|---|
| Open | Gurulle Mary P | $81,200 | |
| Closed | Gurule Mary | $76,000 | |
| Closed | Gurule Mary P | $67,258 |
Source: Public Records
Tax History Compared to Growth
Tax History
| Year | Tax Paid | Tax Assessment Tax Assessment Total Assessment is a certain percentage of the fair market value that is determined by local assessors to be the total taxable value of land and additions on the property. | Land | Improvement |
|---|---|---|---|---|
| 2024 | $507 | $10,040 | -- | -- |
| 2023 | $512 | $13,730 | $1,210 | $12,520 |
| 2022 | $1,026 | $10,340 | $1,250 | $9,090 |
| 2021 | $1,059 | $10,637 | $1,290 | $9,347 |
| 2020 | $755 | $10,640 | $1,290 | $9,350 |
| 2019 | $755 | $7,481 | $787 | $6,694 |
| 2018 | $534 | $5,890 | $792 | $5,098 |
| 2017 | $539 | $5,890 | $792 | $5,098 |
| 2016 | $534 | $5,878 | $876 | $5,002 |
| 2015 | $532 | $5,878 | $876 | $5,002 |
| 2014 | $528 | $5,823 | $876 | $4,947 |
Source: Public Records
Map
Nearby Homes
- 1824 Moore Ave
- 1712 Eden Ave
- 3009 Baystate Ave
- 1709 Henry Ave
- 1705 Eden Ave
- 1812 Garwood Dr
- 1731 Sierra Place
- 1705 Maplewood Dr
- n/a S Prairie Ave
- 1704 Lynwood Ln
- 1809 Lynwood Ln
- 1611 Englewood Dr
- 2416 Columbine Ave
- 60 Stanford Ave
- 0 Cedarwood Rd Unit 21001199
- 0 Cedarwood Rd Unit 11324686
- 0 Cedarwood Rd Unit REC2083565
- 0 Cedarwood Rd Unit 1475837
- 33 Stanford Ave
- 50 Duke St
- 1727 Moore Ave
- 1725 Moore Ave
- 1729 Moore Ave
- 1728 Keeler Ave
- 1723 Moore Ave
- 1726 Keeler Ave
- 1730 Keeler Ave
- 1724 Keeler Ave
- 1728 Moore Ave
- 1721 Moore Ave
- 1726 Moore Ave
- 1730 Moore Ave
- 1724 Moore Ave
- 1722 Keeler Ave
- 1719 Moore Ave
- 1722 Moore Ave
- 1720 Keeler Ave
- 1727 Keeler Ave
- 1727 Quillian Ave
- 1720 Moore Ave