1727 Randon Way Santa Rosa, CA 95403
Northwest Santa Rosa NeighborhoodEstimated Value: $734,891 - $820,000
3
Beds
3
Baths
2,070
Sq Ft
$376/Sq Ft
Est. Value
About This Home
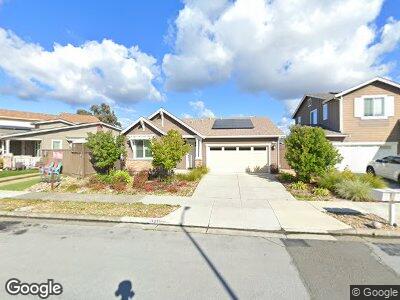
This home is located at 1727 Randon Way, Santa Rosa, CA 95403 and is currently estimated at $778,973, approximately $376 per square foot. 1727 Randon Way is a home located in Sonoma County with nearby schools including Hilliard Comstock Middle School, Piner High School, and Morrice Schaefer Charter School.
Ownership History
Date
Name
Owned For
Owner Type
Purchase Details
Closed on
Nov 8, 2023
Sold by
Molnar Carla
Bought by
Carla D Molnar 2023 Trust and Molnar
Current Estimated Value
Purchase Details
Closed on
Jan 1, 1999
Sold by
Cynthia Ridge
Bought by
Molnar Carla
Home Financials for this Owner
Home Financials are based on the most recent Mortgage that was taken out on this home.
Original Mortgage
$138,000
Interest Rate
6.73%
Mortgage Type
Purchase Money Mortgage
Purchase Details
Closed on
Oct 6, 1998
Sold by
Cynthia Ridge
Bought by
Ridge Cynthia and Molnar Carla
Purchase Details
Closed on
Sep 22, 1994
Sold by
Morbo Joseph A and Morbo Marilee
Bought by
Ridge Cynthia
Home Financials for this Owner
Home Financials are based on the most recent Mortgage that was taken out on this home.
Original Mortgage
$135,000
Interest Rate
3.62%
Mortgage Type
Purchase Money Mortgage
Create a Home Valuation Report for This Property
The Home Valuation Report is an in-depth analysis detailing your home's value as well as a comparison with similar homes in the area
Home Values in the Area
Average Home Value in this Area
Purchase History
| Date | Buyer | Sale Price | Title Company |
|---|---|---|---|
| Carla D Molnar 2023 Trust | -- | None Listed On Document | |
| Molnar Carla | $89,000 | Northwestern Title | |
| Ridge Cynthia | -- | -- | |
| Ridge Cynthia | $185,000 | North Bay Title Co |
Source: Public Records
Mortgage History
| Date | Status | Borrower | Loan Amount |
|---|---|---|---|
| Previous Owner | Molnar Carla Dawn | $71,800 | |
| Previous Owner | Molnar Carla | $150,000 | |
| Previous Owner | Molnar Carla | $152,000 | |
| Previous Owner | Molnar Carla | $60,000 | |
| Previous Owner | Molnar Carla | $138,000 | |
| Previous Owner | Ridge Cynthia | $135,000 |
Source: Public Records
Tax History Compared to Growth
Tax History
| Year | Tax Paid | Tax Assessment Tax Assessment Total Assessment is a certain percentage of the fair market value that is determined by local assessors to be the total taxable value of land and additions on the property. | Land | Improvement |
|---|---|---|---|---|
| 2023 | $3,836 | $339,026 | $113,004 | $226,022 |
| 2022 | $3,590 | $332,380 | $110,789 | $221,591 |
| 2021 | $3,754 | $325,864 | $108,617 | $217,247 |
| 2020 | $1,232 | $107,504 | $107,504 | $0 |
| 2019 | $1,208 | $105,397 | $105,397 | $0 |
| 2018 | $1,193 | $103,331 | $103,331 | $0 |
| 2017 | $3,586 | $303,924 | $101,305 | $202,619 |
| 2016 | $3,546 | $297,966 | $99,319 | $198,647 |
| 2015 | $3,420 | $293,492 | $97,828 | $195,664 |
| 2014 | $3,292 | $287,744 | $95,912 | $191,832 |
Source: Public Records
Map
Nearby Homes
- 1748 Randon Way
- 2370 Battersea St
- 1777 Elwin Ln
- 2433 Penbrooke Ave
- 1655 Kerry Ln
- 1647 Kerry Ln
- 2113 Dennis Ln
- 2340 Brompton Ave
- 2039 Dennis Ln
- 2543 Francisco Ave
- 2300 Claiborne Cir
- 2318 Francisco Ave
- 2289 Claiborne Cir
- 3765 Mocha Ln
- 2187 Tarata Place
- 3748 Mocha Ln
- 2263 Orleans St
- 2299 San Miguel Ave
- 3476 San Sonita Dr
- 2269 Dancing Penny Way
- 1727 Randon Way
- 1723 Randon Way
- 1731 Randon Way
- 1719 Randon Way
- 1735 Randon Way
- 1742 Kerry Ln
- 1744 Kerry Ln
- 1740 Kerry Ln
- 1715 Randon Way
- 1741 Randon Way
- 1730 Randon Way
- 1732 Randon Way
- 1726 Randon Way
- 1746 Kerry Ln
- 1738 Kerry Ln
- 1722 Randon Way
- 1736 Randon Way
- 1745 Randon Way
- 1711 Randon Way
- 1718 Randon Way