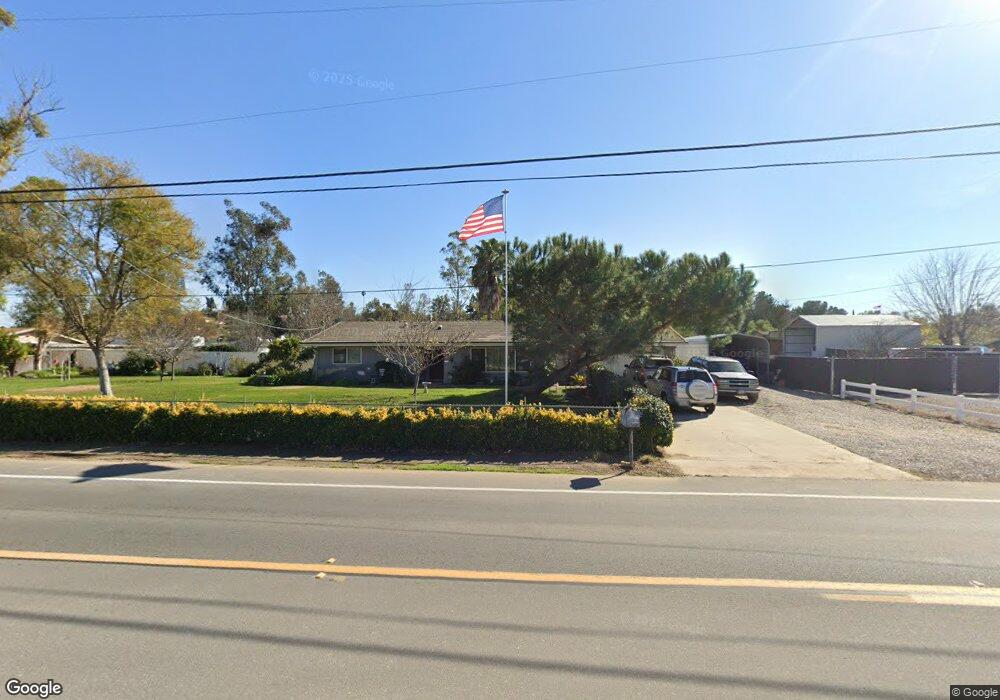
1728 Hanson Ln Ramona, CA 92065
Estimated Value: $790,793 - $853,000
3
Beds
2
Baths
1,877
Sq Ft
$442/Sq Ft
Est. Value
About This Home
This home is located at 1728 Hanson Ln, Ramona, CA 92065 and is currently estimated at $830,198, approximately $442 per square foot. 1728 Hanson Ln is a home located in San Diego County with nearby schools including Hanson Elementary School, Olive Peirce Middle School, and Ramona High School.
Ownership History
Date
Name
Owned For
Owner Type
Purchase Details
Closed on
Jul 28, 2021
Sold by
Scott Lorrie Ann
Bought by
Scott Lorrie Ann and The Scott Family Trust
Current Estimated Value
Home Financials for this Owner
Home Financials are based on the most recent Mortgage that was taken out on this home.
Original Mortgage
$100,000
Outstanding Balance
$62,511
Interest Rate
2.8%
Mortgage Type
New Conventional
Estimated Equity
$767,687
Purchase Details
Closed on
Feb 26, 2018
Sold by
Scott John Howard and Scott Lorrie Ann
Bought by
Scott John Howard and Scott Lorrie Ann
Purchase Details
Closed on
Sep 18, 2012
Sold by
Scott John H and Scott Lorrie A
Bought by
Scott John and Scott Lorrie
Purchase Details
Closed on
Feb 22, 1989
Bought by
Scott John H Lorrie A
Purchase Details
Closed on
Dec 8, 1988
Create a Home Valuation Report for This Property
The Home Valuation Report is an in-depth analysis detailing your home's value as well as a comparison with similar homes in the area
Home Values in the Area
Average Home Value in this Area
Purchase History
| Date | Buyer | Sale Price | Title Company |
|---|---|---|---|
| Scott Lorrie Ann | -- | Amrock Llc | |
| Scott Lorrie Ann | -- | Amrock Llc | |
| Scott John Howard | -- | None Available | |
| Scott John Howard | -- | None Available | |
| Scott John | -- | None Available | |
| Scott John H Lorrie A | $141,000 | -- | |
| -- | $120,000 | -- |
Source: Public Records
Mortgage History
| Date | Status | Borrower | Loan Amount |
|---|---|---|---|
| Open | Scott Lorrie Ann | $100,000 |
Source: Public Records
Tax History
| Year | Tax Paid | Tax Assessment Tax Assessment Total Assessment is a certain percentage of the fair market value that is determined by local assessors to be the total taxable value of land and additions on the property. | Land | Improvement |
|---|---|---|---|---|
| 2025 | $4,587 | $330,075 | $112,577 | $217,498 |
| 2024 | $4,587 | $323,604 | $110,370 | $213,234 |
| 2023 | $4,135 | $317,259 | $108,206 | $209,053 |
| 2022 | $4,273 | $311,039 | $106,085 | $204,954 |
| 2021 | $4,212 | $304,941 | $104,005 | $200,936 |
| 2020 | $4,178 | $301,815 | $102,939 | $198,876 |
| 2019 | $4,081 | $295,898 | $100,921 | $194,977 |
| 2018 | $3,978 | $290,097 | $98,943 | $191,154 |
| 2017 | $3,917 | $284,409 | $97,003 | $187,406 |
| 2016 | $3,825 | $278,833 | $95,101 | $183,732 |
| 2015 | $3,739 | $274,646 | $93,673 | $180,973 |
| 2014 | $3,630 | $269,267 | $91,839 | $177,428 |
Source: Public Records
Map
Nearby Homes
- 1804 El Cajon Ln
- 1287 Hanson Way
- 1537 H St Unit SPC 30
- 1537 H St Unit SPC 54
- 1278 San Vicente Rd
- 0 Raymond Ave Unit NDP2406052
- 779 14th St
- 2209 Boundary Ave
- 1367 H St
- 1340 H St
- 1359 H St
- 0 Boundary Ave Unit 260006074
- 1465 Barnett Rd
- 1212 H St Unit 121
- 1212 H St Unit 21
- 1212 H St Unit 202
- 1212 H St Unit 14
- 1212 H St Unit 95
- 1212 H St Unit 120
- 1212 H St Unit 48
- 1718 Hanson Ln
- 1740 Hanson Ln
- 1299 Anna Rose Ln
- 1756 Hanson Ln
- 1298 Anna Rose Ln
- 1759 El Cajon Ln
- 1287 Anna Rose Ln
- 1286 Anna Rose Ln
- 1764 Hanson Ln
- 1749 Hanson Ln
- 1123 School Daze Ln
- 0000 Hanson Ln
- 1143 Hanson Way
- 1145 School Daze Ln
- 1775 El Cajon Ln
- 1169 Hanson Way
- 1655 Hanson Ln
- 1274 Anna Rose Ln
- 1229 Anna Rose Ln
- 1177 School Daze Ln
Your Personal Tour Guide
Ask me questions while you tour the home.