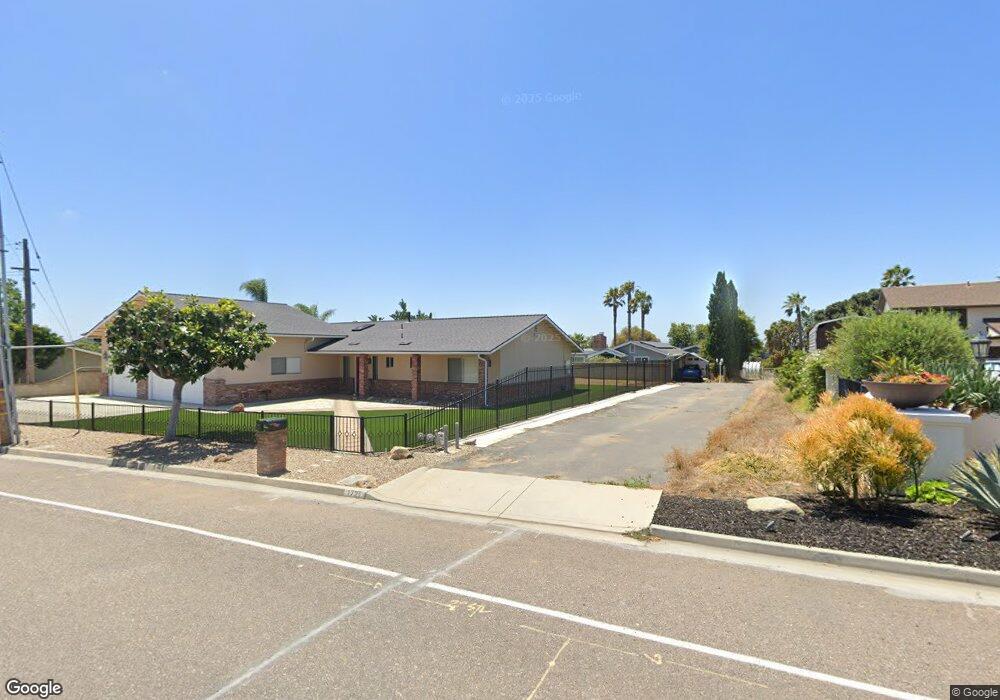
1729 Ivy Rd Oceanside, CA 92054
Fire Mountain NeighborhoodEstimated Value: $1,695,000 - $2,031,000
4
Beds
4
Baths
3,290
Sq Ft
$570/Sq Ft
Est. Value
About This Home
This home is located at 1729 Ivy Rd, Oceanside, CA 92054 and is currently estimated at $1,875,360, approximately $570 per square foot. 1729 Ivy Rd is a home located in San Diego County with nearby schools including Palmquist Elementary School, Lincoln Middle School, and Oceanside High School.
Ownership History
Date
Name
Owned For
Owner Type
Purchase Details
Closed on
Nov 13, 2022
Sold by
Park Geoffrey and Park Devon
Bought by
Dgp Family Trust
Current Estimated Value
Purchase Details
Closed on
Feb 7, 2018
Sold by
Park Geoffrey Arthur and Park Tracy Sue
Bought by
Park Geoffrey Arthur
Purchase Details
Closed on
Nov 15, 2002
Sold by
Park Geoffrey Arthur and Park Tracy Sue
Bought by
Park Geoffrey Arthur and Park Tracy Sue
Home Financials for this Owner
Home Financials are based on the most recent Mortgage that was taken out on this home.
Original Mortgage
$174,850
Interest Rate
5.52%
Mortgage Type
Purchase Money Mortgage
Purchase Details
Closed on
Feb 4, 2002
Sold by
Park Geoffrey Arthur and Park Tracy Sue
Bought by
Park Geoffrey Arthur and Park Tracy Sue
Purchase Details
Closed on
Jul 1, 1991
Purchase Details
Closed on
Mar 8, 1988
Create a Home Valuation Report for This Property
The Home Valuation Report is an in-depth analysis detailing your home's value as well as a comparison with similar homes in the area
Home Values in the Area
Average Home Value in this Area
Purchase History
| Date | Buyer | Sale Price | Title Company |
|---|---|---|---|
| Dgp Family Trust | -- | -- | |
| Park Geoffrey Arthur | -- | None Available | |
| Park Geoffrey Arthur | -- | Orange Coast | |
| Park Geoffrey Arthur | -- | -- | |
| -- | $332,000 | -- | |
| -- | $74,000 | -- |
Source: Public Records
Mortgage History
| Date | Status | Borrower | Loan Amount |
|---|---|---|---|
| Previous Owner | Park Geoffrey Arthur | $174,850 |
Source: Public Records
Tax History
| Year | Tax Paid | Tax Assessment Tax Assessment Total Assessment is a certain percentage of the fair market value that is determined by local assessors to be the total taxable value of land and additions on the property. | Land | Improvement |
|---|---|---|---|---|
| 2025 | $7,600 | $687,672 | $233,407 | $454,265 |
| 2024 | $7,600 | $674,189 | $228,831 | $445,358 |
| 2023 | $7,365 | $660,971 | $224,345 | $436,626 |
| 2022 | $7,176 | $648,012 | $219,947 | $428,065 |
| 2021 | $7,202 | $635,307 | $215,635 | $419,672 |
| 2020 | $6,979 | $628,793 | $213,424 | $415,369 |
| 2019 | $6,775 | $616,465 | $209,240 | $407,225 |
| 2018 | $6,702 | $604,379 | $205,138 | $399,241 |
| 2017 | $70 | $592,529 | $201,116 | $391,413 |
| 2016 | $6,360 | $580,912 | $197,173 | $383,739 |
| 2015 | $6,174 | $572,187 | $194,212 | $377,975 |
| 2014 | $5,934 | $560,979 | $190,408 | $370,571 |
Source: Public Records
Map
Nearby Homes
- 1765 Ivy Rd
- 1773 Ivy Rd
- 1782 Troy Ln
- 1738 Kurtz St
- 1850 Downs St
- 1720 California St
- 1519 Kurtz St
- 1520 Downs St
- 1513 California St
- 1504 Valencia St
- 2241 California St
- 1535 Molly Cir
- 2070 Rue de la Montagne
- 2245 Ivy Rd
- 1806 Stewart St
- 1470 Burroughs St
- 2309 Loker Way
- 2301 Ivy Rd
- 2306 Loker Way
- 2308 Loker Way
- 1727 Ivy Rd
- 1719 Fire Mountain Dr
- 1721 Ivy Rd
- 1735 Ivy Rd
- 1715 Fire Mountain Dr
- 1711 Boxwood Way
- 1725 Ivy Rd
- 1723 Ivy Rd
- 1723 Fire Mountain Dr
- 1707 Boxwood Way
- 1743 Fire Mountain Dr
- 1708 Boxwood Way
- 1756 Woodbine Place
- 1737 Ivy Rd
- 1764 Woodbine Place
- 1752 Woodbine Place
- 00 Fire Mountain Dr
- 1768 Woodbine Place
- 1739 Ivy Rd
- 1748 Woodbine Place
Your Personal Tour Guide
Ask me questions while you tour the home.