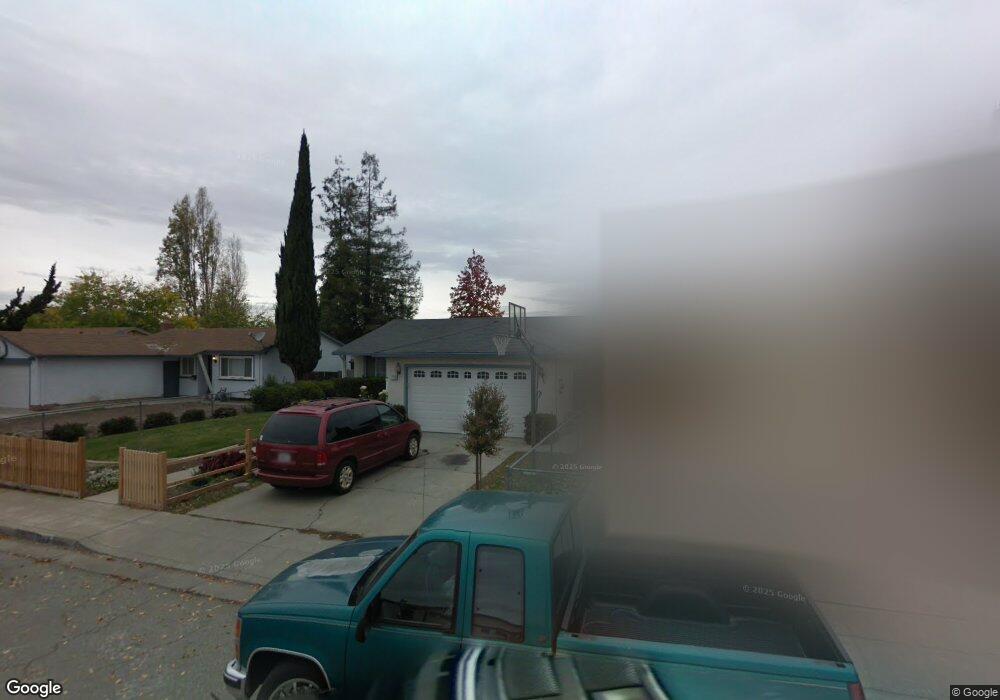
1729 View Dr Milpitas, CA 95035
Estimated Value: $1,435,010 - $1,723,000
4
Beds
2
Baths
1,186
Sq Ft
$1,298/Sq Ft
Est. Value
About This Home
This home is located at 1729 View Dr, Milpitas, CA 95035 and is currently estimated at $1,539,503, approximately $1,298 per square foot. 1729 View Dr is a home located in Santa Clara County with nearby schools including William Burnett Elementary School, Rancho Milpitas Middle School, and Milpitas High School.
Ownership History
Date
Name
Owned For
Owner Type
Purchase Details
Closed on
Jun 20, 2005
Sold by
Chan Renee and Chan Kim Fung
Bought by
Buenconsejo Edgar C and Buenconsejo Maria Riza
Current Estimated Value
Home Financials for this Owner
Home Financials are based on the most recent Mortgage that was taken out on this home.
Original Mortgage
$586,148
Outstanding Balance
$295,701
Interest Rate
5.24%
Mortgage Type
Negative Amortization
Estimated Equity
$1,243,802
Purchase Details
Closed on
Oct 31, 2000
Sold by
Smith Kenneth E and Marianne Bristol
Bought by
Chan Renee and Chan Kim Fung
Home Financials for this Owner
Home Financials are based on the most recent Mortgage that was taken out on this home.
Original Mortgage
$352,000
Interest Rate
7.5%
Purchase Details
Closed on
Oct 23, 1998
Sold by
Smith Kenneth E and Bristol Marianne
Bought by
Smith Kenneth Eugene and Bristol Marianne
Home Financials for this Owner
Home Financials are based on the most recent Mortgage that was taken out on this home.
Original Mortgage
$176,000
Interest Rate
6.6%
Create a Home Valuation Report for This Property
The Home Valuation Report is an in-depth analysis detailing your home's value as well as a comparison with similar homes in the area
Home Values in the Area
Average Home Value in this Area
Purchase History
| Date | Buyer | Sale Price | Title Company |
|---|---|---|---|
| Buenconsejo Edgar C | $652,000 | Financial Title Company | |
| Chan Renee | $440,000 | First American Title Co | |
| Smith Kenneth Eugene | -- | American Title Co |
Source: Public Records
Mortgage History
| Date | Status | Borrower | Loan Amount |
|---|---|---|---|
| Open | Buenconsejo Edgar C | $586,148 | |
| Previous Owner | Chan Renee | $352,000 | |
| Previous Owner | Smith Kenneth Eugene | $176,000 | |
| Closed | Chan Renee | $44,000 |
Source: Public Records
Tax History
| Year | Tax Paid | Tax Assessment Tax Assessment Total Assessment is a certain percentage of the fair market value that is determined by local assessors to be the total taxable value of land and additions on the property. | Land | Improvement |
|---|---|---|---|---|
| 2025 | $10,360 | $908,811 | $363,522 | $545,289 |
| 2024 | $10,360 | $890,993 | $356,395 | $534,598 |
| 2023 | $10,327 | $873,523 | $349,407 | $524,116 |
| 2022 | $10,283 | $856,396 | $342,556 | $513,840 |
| 2021 | $10,133 | $839,605 | $335,840 | $503,765 |
| 2020 | $9,956 | $830,997 | $332,397 | $498,600 |
| 2019 | $9,841 | $814,704 | $325,880 | $488,824 |
| 2018 | $9,343 | $798,731 | $319,491 | $479,240 |
| 2017 | $9,221 | $783,071 | $313,227 | $469,844 |
| 2016 | $8,848 | $767,718 | $307,086 | $460,632 |
| 2015 | $7,356 | $633,000 | $253,200 | $379,800 |
| 2014 | $6,244 | $540,000 | $216,000 | $324,000 |
Source: Public Records
Map
Nearby Homes
- 258 Lynn Ave
- 122 Poppy Ct
- 1995 Old Calaveras Rd
- 25 Terfidia Ln
- 533 Ramos Ct
- 70 Fanyon St
- 397 S Park Victoria Dr
- 496 Dempsey Rd Unit 199
- 808 Cameron Cir
- 484 Dempsey Rd Unit 186
- 1103 Creed St
- 2202 Yosemite Dr
- 685 Parvin Dr
- 1000 Jacklin Rd
- 1260 Glacier Dr
- 931 Galindo Ct
- 1308 N Hillview Dr
- 1490 Mount Diablo Ave
- 979 Sandalridge Ct
- 997 Courtland Ct
Your Personal Tour Guide
Ask me questions while you tour the home.