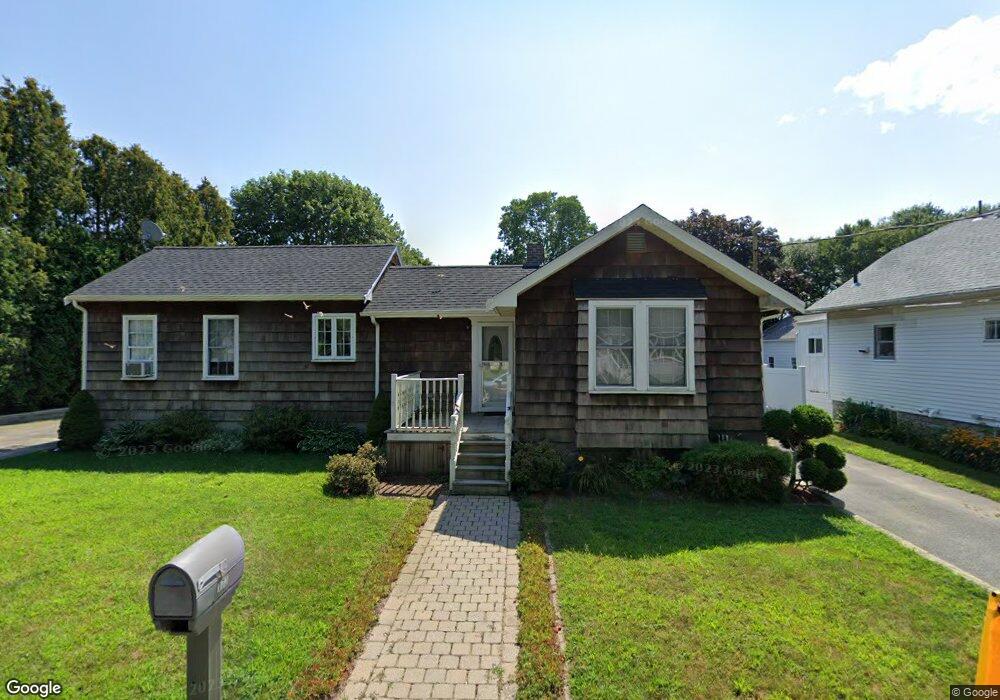
173 Compos St Somerset, MA 02726
Somerset Historic Village NeighborhoodEstimated Value: $418,000 - $542,000
3
Beds
1
Bath
1,184
Sq Ft
$409/Sq Ft
Est. Value
About This Home
This home is located at 173 Compos St, Somerset, MA 02726 and is currently estimated at $483,722, approximately $408 per square foot. 173 Compos St is a home located in Bristol County with nearby schools including North Elementary School and Somerset Middle School.
Ownership History
Date
Name
Owned For
Owner Type
Purchase Details
Closed on
Mar 20, 1997
Sold by
Berube James P and Berube Michelle J
Bought by
Medeiros Timothy J and Perras Sandra
Current Estimated Value
Purchase Details
Closed on
Oct 24, 1988
Sold by
Rogers Laurence
Bought by
Berube James Paul
Create a Home Valuation Report for This Property
The Home Valuation Report is an in-depth analysis detailing your home's value as well as a comparison with similar homes in the area
Home Values in the Area
Average Home Value in this Area
Purchase History
| Date | Buyer | Sale Price | Title Company |
|---|---|---|---|
| Medeiros Timothy J | $119,700 | -- | |
| Medeiros Timothy J | $119,700 | -- | |
| Berube James Paul | $89,000 | -- |
Source: Public Records
Mortgage History
| Date | Status | Borrower | Loan Amount |
|---|---|---|---|
| Open | Berube James Paul | $216,218 | |
| Closed | Berube James Paul | $30,000 |
Source: Public Records
Tax History
| Year | Tax Paid | Tax Assessment Tax Assessment Total Assessment is a certain percentage of the fair market value that is determined by local assessors to be the total taxable value of land and additions on the property. | Land | Improvement |
|---|---|---|---|---|
| 2025 | $5,371 | $403,800 | $189,600 | $214,200 |
| 2024 | $5,056 | $395,300 | $189,600 | $205,700 |
| 2023 | $4,428 | $349,200 | $165,000 | $184,200 |
| 2022 | $4,100 | $308,500 | $143,500 | $165,000 |
| 2021 | $4,141 | $282,100 | $130,500 | $151,600 |
| 2020 | $4,064 | $267,000 | $130,500 | $136,500 |
| 2019 | $4,667 | $255,700 | $130,500 | $125,200 |
| 2018 | $4,131 | $243,600 | $130,500 | $113,100 |
| 2017 | $4,039 | $232,100 | $124,500 | $107,600 |
| 2016 | $4,064 | $232,100 | $124,500 | $107,600 |
| 2015 | $3,881 | $223,700 | $118,900 | $104,800 |
| 2014 | $5,125 | $212,200 | $115,400 | $96,800 |
Source: Public Records
Map
Nearby Homes
- 560 North St
- 0 Palmer St
- 485 Whetstone Hill Rd
- 989 Elm St
- 107 Manchester Ave
- 135 Sutherland Dr
- 499 Elm St
- 2798 Elm St
- 145 Mount Hope Rd
- Lot 2 Millers Ln
- 915 Almy Rd
- 65 Marvel St
- 418 Hart St
- 35 Water St
- 5065 N Main St Unit 2
- 5455 N Main St Unit 10B
- 3057 Clubhouse Dr Unit Model
- 3035 Clubhouse Dr Unit 6
- 3051 Clubhouse Dr Unit 78
- 22 Apple Creek Ln
Your Personal Tour Guide
Ask me questions while you tour the home.