

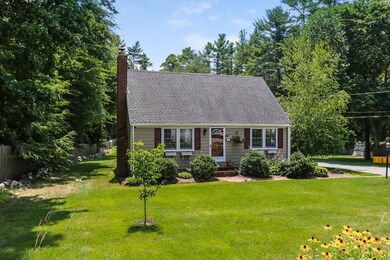

173 Holmes St Halifax, MA 02338
Harrubs Corner Neighborhood
3
Beds
3
Baths
1,344
Sq Ft
1.39
Acres
Highlights
- Deck
- Wood Flooring
- Forced Air Heating System
About This Home
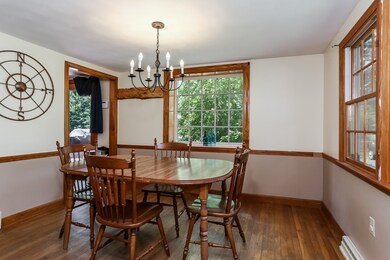
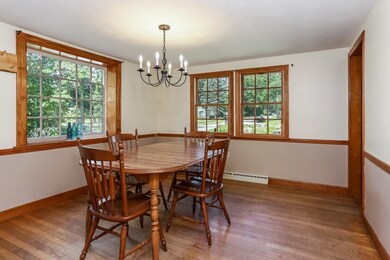
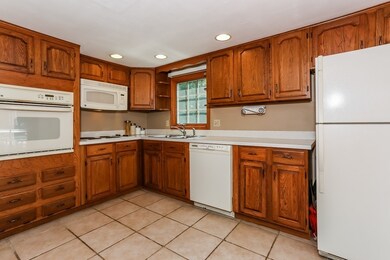
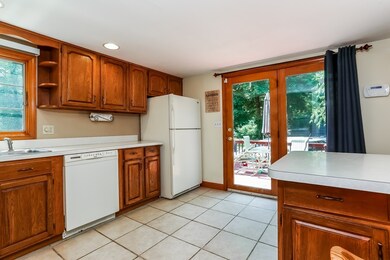
As of July 2025Welcome to Halifax! This picture perfect Cape is move in ready, and is located in the charming town of Halifax.This home has so much to offer! With 3 spacious bedrooms and tons of living space, you'll have room to roam with your growing family and guests. You'll find the country kitchen and dining area offers plenty of space to entertain. Down the hall you'll find the living room with cozy fireplace/wood stove, also an additional bedroom/office on the main level great for right sizers. Upstairs you will find the master and other bedroom, both generous in size. Oversized windows offers tons of natural light and right off the kitchen there is a large deck, perfect for grilling and outdoor entertaining. The picturesque backyard complete with shed goes on and on. The basement is partially finished, still plenty of room for storage. Pride of ownership shines throughout this well maintained home. Perfect for 1st time home buyers,or if you're looking to downsize. Don't let this one get away!
Last Agent to Sell the Property
Boston Connect Real Estate License #455022998 Listed on: 11/18/2018
Home Details
Home Type
- Single Family
Est. Annual Taxes
- $6,877
Year Built
- Built in 1964
Kitchen
- Built-In Oven
- Built-In Range
- Microwave
- Dishwasher
Flooring
- Wood
- Wall to Wall Carpet
- Tile
Outdoor Features
- Deck
- Rain Gutters
Utilities
- Forced Air Heating System
- Heating System Uses Oil
- Oil Water Heater
- Sewer Inspection Required for Sale
- Cable TV Available
Additional Features
- Window Screens
- Property is zoned Res A
- Basement
Similar Homes in Halifax, MA
Create a Home Valuation Report for This Property
The Home Valuation Report is an in-depth analysis detailing your home's value as well as a comparison with similar homes in the area
Home Values in the Area
Average Home Value in this Area
Mortgage History
| Date | Status | Loan Amount | Loan Type |
|---|---|---|---|
| Closed | $408,000 | Purchase Money Mortgage | |
| Closed | $318,570 | FHA | |
| Closed | $318,019 | FHA | |
| Closed | $283,100 | New Conventional | |
| Closed | $275,805 | New Conventional | |
| Closed | $18,000 | No Value Available | |
| Closed | $204,784 | No Value Available |
Source: Public Records
Property History
| Date | Event | Price | Change | Sq Ft Price |
|---|---|---|---|---|
| 07/14/2025 07/14/25 | Sold | $616,000 | +2.8% | $442 / Sq Ft |
| 06/23/2025 06/23/25 | Pending | -- | -- | -- |
| 06/18/2025 06/18/25 | For Sale | $599,000 | +17.5% | $429 / Sq Ft |
| 09/27/2022 09/27/22 | Sold | $510,000 | +7.4% | $292 / Sq Ft |
| 08/28/2022 08/28/22 | Pending | -- | -- | -- |
| 08/25/2022 08/25/22 | For Sale | $474,900 | +44.7% | $272 / Sq Ft |
| 01/08/2019 01/08/19 | Sold | $328,250 | -0.2% | $244 / Sq Ft |
| 11/21/2018 11/21/18 | Pending | -- | -- | -- |
| 11/18/2018 11/18/18 | For Sale | $329,000 | +10.4% | $245 / Sq Ft |
| 07/10/2015 07/10/15 | Sold | $298,000 | 0.0% | $222 / Sq Ft |
| 05/08/2015 05/08/15 | Off Market | $298,000 | -- | -- |
| 05/07/2015 05/07/15 | For Sale | $295,000 | +9.3% | $219 / Sq Ft |
| 06/29/2012 06/29/12 | Sold | $270,000 | -8.1% | $201 / Sq Ft |
| 06/24/2012 06/24/12 | Pending | -- | -- | -- |
| 05/01/2012 05/01/12 | For Sale | $293,900 | +8.9% | $219 / Sq Ft |
| 04/30/2012 04/30/12 | Off Market | $270,000 | -- | -- |
| 03/09/2012 03/09/12 | Price Changed | $293,900 | -6.7% | $219 / Sq Ft |
| 11/02/2011 11/02/11 | For Sale | $314,900 | -- | $234 / Sq Ft |
Source: MLS Property Information Network (MLS PIN)
Tax History Compared to Growth
Tax History
| Year | Tax Paid | Tax Assessment Tax Assessment Total Assessment is a certain percentage of the fair market value that is determined by local assessors to be the total taxable value of land and additions on the property. | Land | Improvement |
|---|---|---|---|---|
| 2025 | $6,877 | $481,900 | $184,100 | $297,800 |
| 2024 | $6,548 | $454,700 | $168,300 | $286,400 |
| 2023 | $6,419 | $431,400 | $163,400 | $268,000 |
| 2022 | $6,223 | $388,700 | $145,900 | $242,800 |
| 2021 | $5,895 | $339,000 | $140,300 | $198,700 |
| 2020 | $5,541 | $317,700 | $140,300 | $177,400 |
| 2019 | $5,391 | $308,600 | $136,200 | $172,400 |
| 2018 | $5,143 | $291,400 | $128,500 | $162,900 |
| 2017 | $5,133 | $277,000 | $128,500 | $148,500 |
| 2016 | $4,924 | $255,800 | $120,200 | $135,600 |
| 2015 | $4,858 | $255,800 | $120,200 | $135,600 |
Source: Public Records
Agents Affiliated with this Home
-
Karen Bandera
K
Seller's Agent in 2025
Karen Bandera
South Shore Sotheby's International Realty
1 in this area
46 Total Sales
-
Jill Cooney
J
Seller Co-Listing Agent in 2025
Jill Cooney
South Shore Sotheby's International Realty
1 in this area
2 Total Sales
-
Abigail Andreson
A
Buyer's Agent in 2025
Abigail Andreson
ALANTE Real Estate
1 in this area
22 Total Sales
-
Dakota Riley
Seller's Agent in 2022
Dakota Riley
Keller Williams Realty
(781) 883-7980
1 in this area
349 Total Sales
-
Jan Bruno
Buyer's Agent in 2022
Jan Bruno
Keller Williams Realty Signature Properties
(617) 347-4890
1 in this area
103 Total Sales
-
Tracy Grady
Seller's Agent in 2019
Tracy Grady
Boston Connect
(617) 842-4019
68 Total Sales
Map
Source: MLS Property Information Network (MLS PIN)
MLS Number: 72425272
APN: HALI-000043-000000-000009F
Disclaimer: Certain information contained herein is derived from information provided by parties other than Homes.com. All information provided is deemed reliable, but is not guaranteed to be accurate and should be independently verified.
![]() The property listing data and information, or the Images, set forth herein were provided to MLS Property Information Network, Inc. from third party sources, including sellers, lessors and public records, and were compiled by MLS Property Information Network, Inc. The property listing data and information, and the Images, are for the personal, non-commercial use of consumers having a good faith interest in purchasing or leasing listed properties of the type displayed to them and may not be used for any purpose other than to identify prospective properties which such consumers may have a good faith interest in purchasing or leasing. MLS Property Information Network, Inc. and its subscribers disclaim any and all representations and warranties as to the accuracy of the property listing data and information, or as to the accuracy of any of the Images, set forth herein.
The property listing data and information, or the Images, set forth herein were provided to MLS Property Information Network, Inc. from third party sources, including sellers, lessors and public records, and were compiled by MLS Property Information Network, Inc. The property listing data and information, and the Images, are for the personal, non-commercial use of consumers having a good faith interest in purchasing or leasing listed properties of the type displayed to them and may not be used for any purpose other than to identify prospective properties which such consumers may have a good faith interest in purchasing or leasing. MLS Property Information Network, Inc. and its subscribers disclaim any and all representations and warranties as to the accuracy of the property listing data and information, or as to the accuracy of any of the Images, set forth herein.
Nearby Homes
- 57 Twin Lakes Dr
- 105 Twin Lakes Dr
- 13 Hickory Rd
- 50 Annawon Dr
- 71 Annawon Dr
- 336 Twin Lakes Dr
- 579 Twin Lakes Dr Unit 579
- 60 Colby Dr
- 88 Colby Dr
- 12 White Island Rd
- 102 Lake St
- 26 Redwood Dr
- 57 Brandeis Cir
- 75 Maplewood Dr
- 25 Beechwood Rd
- 32 Parkwood Dr
- 8 Beechwood Rd
- 54 Redwood Dr
- 0 Thompson St
- 265 Monponsett St Unit 2203