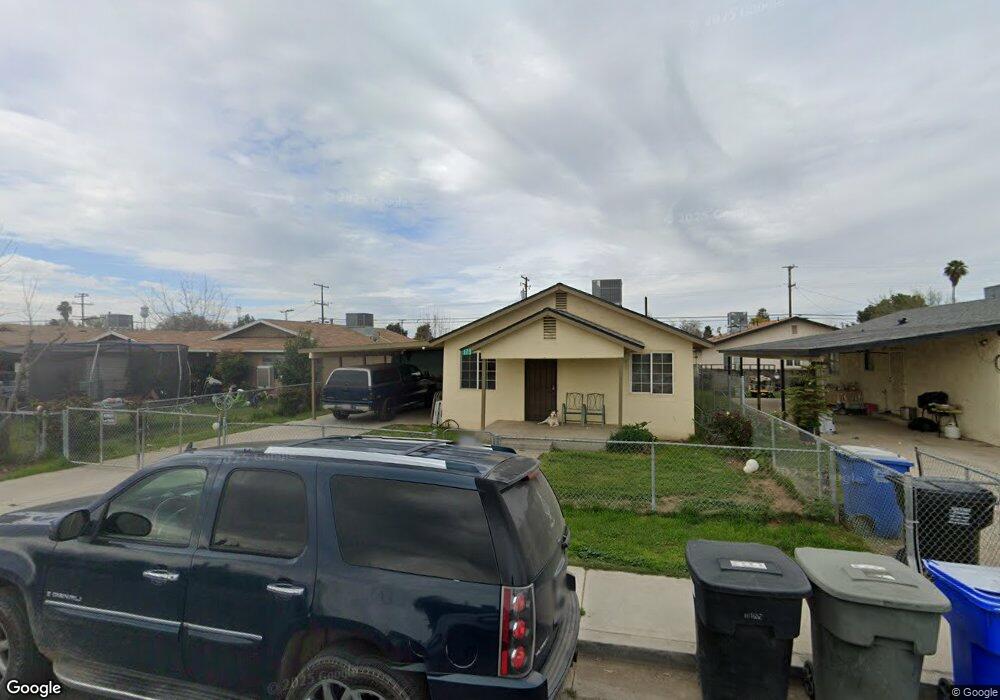
173 N Evans Rd Tipton, CA 93272
Estimated Value: $210,000 - $256,000
4
Beds
2
Baths
1,137
Sq Ft
$211/Sq Ft
Est. Value
About This Home
This home is located at 173 N Evans Rd, Tipton, CA 93272 and is currently estimated at $239,450, approximately $210 per square foot. 173 N Evans Rd is a home with nearby schools including Tipton Elementary School, Palo Verde Elementary School, and Mission Oak High School.
Ownership History
Date
Name
Owned For
Owner Type
Purchase Details
Closed on
Nov 7, 2017
Sold by
Valdez Verenice R
Bought by
Reynozo Manuel and Reynozo Oralia M
Current Estimated Value
Home Financials for this Owner
Home Financials are based on the most recent Mortgage that was taken out on this home.
Original Mortgage
$119,000
Outstanding Balance
$99,795
Interest Rate
3.88%
Mortgage Type
New Conventional
Estimated Equity
$139,655
Purchase Details
Closed on
Jun 21, 2017
Sold by
Valdez Oscar Anthony
Bought by
Valdez Verenice R
Home Financials for this Owner
Home Financials are based on the most recent Mortgage that was taken out on this home.
Original Mortgage
$127,500
Interest Rate
4.02%
Mortgage Type
New Conventional
Purchase Details
Closed on
Dec 6, 2007
Sold by
Dealba Ricardo
Bought by
Reynozo Manuel and Reynozo Oralia
Purchase Details
Closed on
Sep 5, 2004
Sold by
Dealba Jose and Dealba Concha
Bought by
Dealba Susana
Create a Home Valuation Report for This Property
The Home Valuation Report is an in-depth analysis detailing your home's value as well as a comparison with similar homes in the area
Home Values in the Area
Average Home Value in this Area
Purchase History
| Date | Buyer | Sale Price | Title Company |
|---|---|---|---|
| Reynozo Manuel | -- | Old Republic Title Company | |
| Valdez Verenice R | -- | Old Republic Title Company | |
| Reynozo Manuel | -- | Old Republic Title Company | |
| Reynozo Manuel | $115,000 | Alliance Title Company | |
| Dealba Ricardo | -- | Alliance Title Company | |
| Dealba Susana | -- | -- |
Source: Public Records
Mortgage History
| Date | Status | Borrower | Loan Amount |
|---|---|---|---|
| Open | Reynozo Manuel | $119,000 | |
| Previous Owner | Reynozo Manuel | $127,500 |
Source: Public Records
Tax History
| Year | Tax Paid | Tax Assessment Tax Assessment Total Assessment is a certain percentage of the fair market value that is determined by local assessors to be the total taxable value of land and additions on the property. | Land | Improvement |
|---|---|---|---|---|
| 2025 | $2,938 | $264,017 | $59,109 | $204,908 |
| 2024 | $2,938 | $258,841 | $57,950 | $200,891 |
| 2023 | $2,858 | $253,766 | $56,814 | $196,952 |
| 2022 | $2,778 | $248,791 | $55,700 | $193,091 |
| 2021 | $2,732 | $243,913 | $54,608 | $189,305 |
| 2020 | $2,800 | $241,412 | $54,048 | $187,364 |
| 2019 | $2,866 | $236,678 | $52,988 | $183,690 |
| 2018 | $2,819 | $232,037 | $51,949 | $180,088 |
| 2017 | $2,792 | $227,487 | $50,930 | $176,557 |
| 2016 | $2,672 | $223,026 | $49,931 | $173,095 |
| 2015 | $2,519 | $219,676 | $49,181 | $170,495 |
| 2014 | $2,519 | $215,373 | $48,218 | $167,155 |
Source: Public Records
Map
Nearby Homes
- 285 E Jayne Ave
- 364 S Newman Rd
- 300 N Berry Rd
- 0 Avenue 144 Unit 231197
- 12437 Avenue 176 Unit 176
- 10 Avenue 120
- 0 120 Ave Unit FR25132228
- 12394 Ave 184
- 0 Hwy 99 & Ave 184 Unit 11652531
- 0 Hwy 99 & Ave 184 Unit 238899
- 0 Hwy 99 & Ave 184 Unit 225153031
- 12394 Avenue 184
- 0 W Stanford Ave Unit 238175
- 821 E Stanford Ave
- 10351 Avenue 112
- 16500 Road 152
- 0 Road 112 Unit 202510708
- 0 Road 112 Unit 11681417
- 2557 E Stanford Ave
- 7599 Avenue 152
- 189 N Evans Rd
- 157 N Evans Rd
- 145 N Evans Rd
- 201 N Evans Rd
- 224 E Klindera Ave
- 324 Klindera Ave
- 172 N Evans Rd
- 180 N Evans Rd
- 128 N Evans Rd
- 200 N Evans Rd
- 174 N Thompson Rd
- 108 N Evans Rd
- 319 E Woods Ave
- 154 N Thompson Rd
- 285 E Klindera Ave
- 200 N Thompson Rd
- 225 E Woods Ave
- 321 E Klindera Ave
- 167 N Adams Rd
- 299 N Evans Rd
Your Personal Tour Guide
Ask me questions while you tour the home.