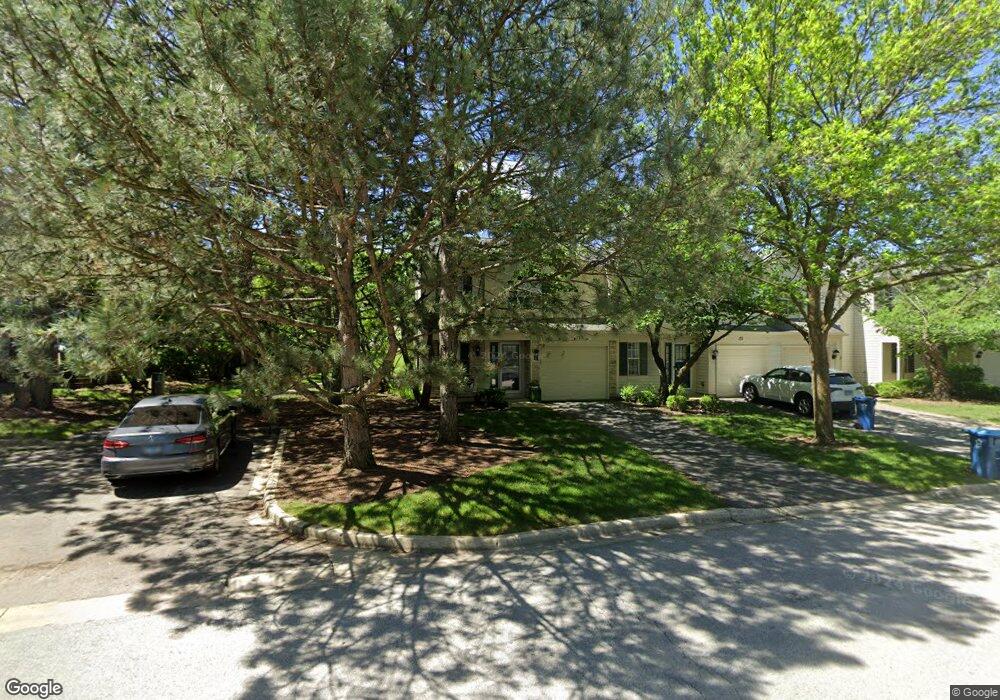
173 Park Ridge Ln Unit I Aurora, IL 60504
Far East NeighborhoodEstimated Value: $269,000 - $290,705
2
Beds
3
Baths
1,402
Sq Ft
$200/Sq Ft
Est. Value
About This Home
This home is located at 173 Park Ridge Ln Unit I, Aurora, IL 60504 and is currently estimated at $279,926, approximately $199 per square foot. 173 Park Ridge Ln Unit I is a home located in DuPage County with nearby schools including McCarty Elementary School, Fischer Middle School, and Waubonsie Valley High School.
Ownership History
Date
Name
Owned For
Owner Type
Purchase Details
Closed on
Jul 31, 2019
Sold by
Malone Jeannine A
Bought by
Malone Jeannine A and Jeannine A Malone Trust
Current Estimated Value
Purchase Details
Closed on
Apr 27, 2001
Sold by
Bandyk Joseph R and Bandyk Megan M
Bought by
Malone Jeannine A
Home Financials for this Owner
Home Financials are based on the most recent Mortgage that was taken out on this home.
Original Mortgage
$125,500
Outstanding Balance
$46,862
Interest Rate
7.03%
Mortgage Type
FHA
Estimated Equity
$233,065
Purchase Details
Closed on
Apr 21, 1997
Sold by
Kolar Marybeth
Bought by
Bandyk Joseph R and Schield Megan M
Home Financials for this Owner
Home Financials are based on the most recent Mortgage that was taken out on this home.
Original Mortgage
$98,150
Interest Rate
8.13%
Create a Home Valuation Report for This Property
The Home Valuation Report is an in-depth analysis detailing your home's value as well as a comparison with similar homes in the area
Home Values in the Area
Average Home Value in this Area
Purchase History
| Date | Buyer | Sale Price | Title Company |
|---|---|---|---|
| Malone Jeannine A | -- | None Available | |
| Malone Jeannine A | $127,500 | -- | |
| Bandyk Joseph R | $109,500 | -- |
Source: Public Records
Mortgage History
| Date | Status | Borrower | Loan Amount |
|---|---|---|---|
| Open | Malone Jeannine A | $125,500 | |
| Previous Owner | Bandyk Joseph R | $98,150 |
Source: Public Records
Tax History Compared to Growth
Tax History
| Year | Tax Paid | Tax Assessment Tax Assessment Total Assessment is a certain percentage of the fair market value that is determined by local assessors to be the total taxable value of land and additions on the property. | Land | Improvement |
|---|---|---|---|---|
| 2024 | $4,606 | $76,579 | $17,150 | $59,429 |
| 2023 | $4,292 | $68,810 | $15,410 | $53,400 |
| 2022 | $4,457 | $64,150 | $14,250 | $49,900 |
| 2021 | $4,315 | $61,860 | $13,740 | $48,120 |
| 2020 | $4,367 | $61,860 | $13,740 | $48,120 |
| 2019 | $4,179 | $58,840 | $13,070 | $45,770 |
| 2018 | $3,527 | $50,930 | $11,400 | $39,530 |
| 2017 | $3,892 | $49,200 | $11,010 | $38,190 |
| 2016 | $3,811 | $47,220 | $10,570 | $36,650 |
| 2015 | $3,757 | $44,840 | $10,040 | $34,800 |
| 2014 | $3,642 | $42,550 | $9,450 | $33,100 |
| 2013 | $3,607 | $42,850 | $9,520 | $33,330 |
Source: Public Records
Map
Nearby Homes
- 441 Park Ridge Ln
- 3506 Willowview Ct
- 75 Saint Croix Ct
- 157 Wildberry Ct
- 178 Wildberry Ct
- 3356 Ravinia Cir
- 3140 Medford Ct
- 3473 Ravinia Cir
- 53 Braxton Ln Unit 107W
- 72 Heather Glen Dr Unit 72
- 458 Watercress Dr
- 765 Clearwood Ct
- 3115 Compton Rd
- 199 N Oakhurst Dr Unit 15W
- 305 Cane Garden Cir
- 703 Avondale Ln
- 3016 Anton Dr
- 372 Springlake Ln Unit C
- 2948 Waters Edge Cir
- 117 Cammeron Ct
- 171 Park Ridge Ln Unit 2
- 169 Park Ridge Ln Unit 2
- 169 Park Ridge Ln
- 3488 Saint Barthelemy Ln Unit 2
- 3486 Saint Barthelemy Ln Unit 2
- 3484 Saint Barthelemy Ln Unit 2
- 167 Park Ridge Ln
- 3482 Saint Barthelemy Ln
- 3490 Saint Barthelemy Ln
- 3478 Saint Barthelemy Ln Unit 2
- 3480 Saint Barthelemy Ln
- 3476 Saint Barthelemy Ln Unit I
- 3476 Saint Barthelemy Ln Unit 3476
- 3476 Saint Barthelemy Ln Unit 5
- 3474 Saint Barthelemy Ln Unit 2
- 3472 Saint Barthelemy Ln Unit 2
- 172 Park Ridge Ln Unit 2
- 3456 Saint Barthelemy Ln
- 174 Park Ridge Ln Unit 2
- 3454 Saint Barthelemy Ln