NOT LISTED FOR SALE

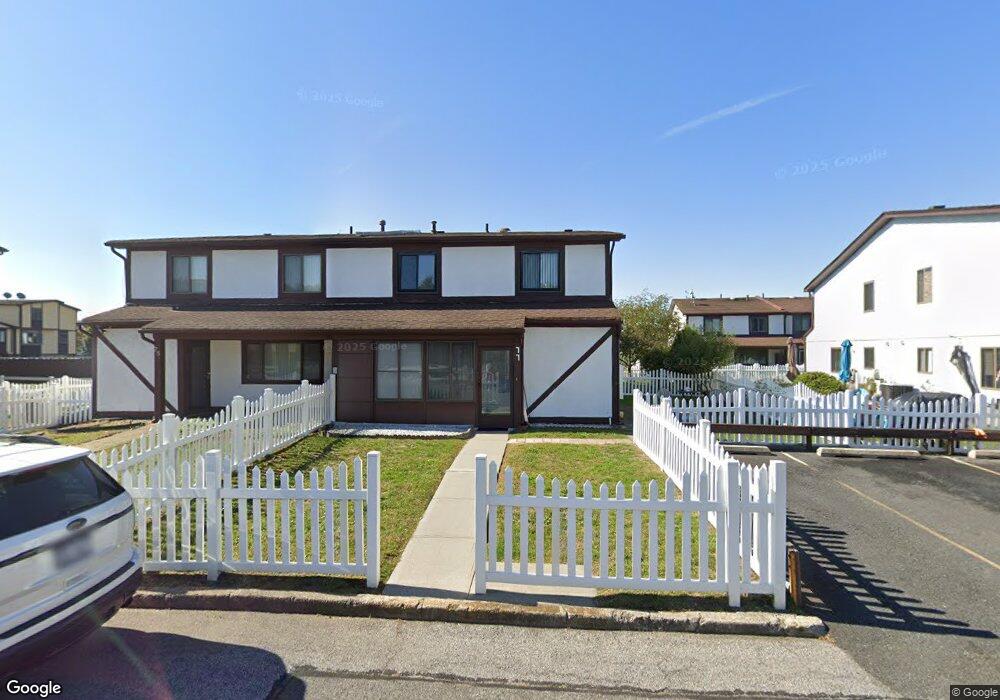
173 Parkview Loop Unit 100 Staten Island, NY 10314

Willowbrook Neighborhood

Estimated Value: $460,000 - $513,000

3 Beds
2 Baths
1,144 Sq Ft
$419/Sq Ft Est. Value

About This Home

This home is located at 173 Parkview Loop Unit 100, Staten Island, NY 10314 and is currently estimated at $479,235, approximately $418 per square foot. 173 Parkview Loop Unit 100 is a home located in Richmond County with nearby schools including P.S. 060 Alice Austen School, Is 72 Rocco Laurie, and Port Richmond High School.

Ownership History

Date Name Owned For Owner Type

Purchase Details

Closed on
Jul 1, 2003
Sold by
Gottesman Rosalind
Bought by
Rodriguez Alfred and Rodriguez Maribel
Current Estimated Value
$479,235

Home Financials for this Owner

Home Financials are based on the most recent Mortgage that was taken out on this home.
Original Mortgage
$201,500
Interest Rate
5.81%
Mortgage Type
Purchase Money Mortgage

Purchase Details

Closed on
Apr 4, 2003
Sold by
Gottesman Mark
Bought by
Gottesman Rosalind

Purchase Details

Closed on
Mar 5, 1998
Sold by
Gottesman Nisha
Bought by
Gottesman Mark

Purchase Details

Closed on
Oct 11, 1994
Sold by
Gottesman Mark and Gottesman Rajkumarie
Bought by
Gottesman Rajkumarie

Purchase Details

Closed on
Jun 16, 1994
Sold by
Lloyd Thomas F
Bought by
Gottesman Mark and Gottesman Rakjumarie

Range of Values:

Collateral Analytics

Collateral Analytics Collateral Analytics AVMs (Automated Valuation Model) employ a number of statistical approaches combined with neighborhood-specific comparable selection guarantees the most up-to-date and precise valuations.

Not Available

Collateral Analytics does not have data for the current month. Please view the chart for historical values.

ICE

ICE Mortgage Technology ICE Mortgage Technology’s AVM (Automated Valuation Model) is a state-of-the-art online residential property valuation tool that provides a quick and accurate estimate of the value of almost any home in the U.S.

Not Available

ICE Mortgage Technology does not have data for the current month. Please view the chart for historical values.

First American

First American First American Data & Analytics’ next-generation AVM combines unrivaled data assets with a blended ensemble of valuation models to produce highly accurate, reliable valuations you can trust.

Not Available

First American does not have data for the current month. Please view the chart for historical values.

Quantarium

Quantarium Quantarium’s valuation service, repeatedly proven the industry’s most accurate and comprehensive, is supercharged with a self-learning and auto-tuning AI engine that continually becomes smarter and more accurate as it processes daily inputs from the industry’s leading RE data lake.

Not Available

Quantarium does not have data for the current month. Please view the chart for historical values.

Average Value
Not Available
List Price
Sold Price
Create a Home Valuation Report for This Property
The Home Valuation Report is an in-depth analysis detailing your home's value as well as a comparison with similar homes in the area

Home Values in the Area

Source: Public Records

Average Home Value in this Area


Source: Public Records

Purchase History

Date Buyer Sale Price Title Company
Rodriguez Alfred $208,200 Prestige Title
Gottesman Rosalind -- Chicago Title Insurance Co
Gottesman Mark $37,000 Stewart Title Insurance Co
Gottesman Rajkumarie -- --
Source: Public Records

Mortgage History

Date Status Borrower Loan Amount
Open Rodriguez Alfred $87,662
Closed Rodriguez Alfred $118,583
Closed Rodriguez Alfred $44,623
Previous Owner Rodriguez Alfred $201,500
Previous Owner Gottesman Mark $111,000
Previous Owner Gottesman Mark $68,400
Source: Public Records

Tax History Compared to Growth

Source: Public Records

Tax History

Year Tax Paid Tax Assessment Tax Assessment Total Assessment is a certain percentage of the fair market value that is determined by local assessors to be the total taxable value of land and additions on the property. Land Improvement
2024 $4,025 $23,734 $2,137 $21,597
2023 $3,840 $18,907 $2,008 $16,899
2022 $3,561 $21,234 $2,531 $18,703
2021 $3,542 $19,334 $2,531 $16,803
2020 $3,562 $19,201 $2,531 $16,670
2019 $3,494 $18,052 $2,531 $15,521
2018 $3,212 $15,756 $2,252 $13,504
2017 $3,030 $14,865 $2,304 $12,561
2016 $2,804 $14,025 $2,217 $11,808
2015 $2,671 $14,025 $2,082 $11,943
2014 $2,671 $13,918 $2,455 $11,463
Source: Public Records

Map