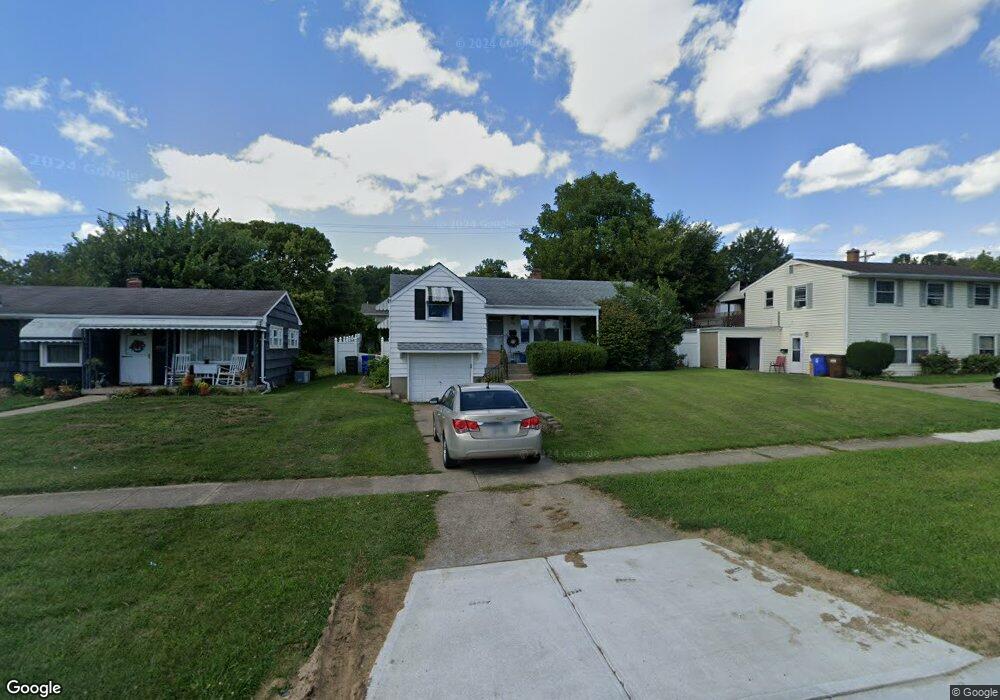
1730 NW Washington Blvd Hamilton, OH 45013
Estimated Value: $215,263 - $227,000
3
Beds
2
Baths
1,233
Sq Ft
$181/Sq Ft
Est. Value
About This Home
This home is located at 1730 NW Washington Blvd, Hamilton, OH 45013 and is currently estimated at $223,316, approximately $181 per square foot. 1730 NW Washington Blvd is a home located in Butler County with nearby schools including Bridgeport Elementary School, Wilson Middle School, and Hamilton High School Main Campus.
Ownership History
Date
Name
Owned For
Owner Type
Purchase Details
Closed on
May 12, 2014
Sold by
Hapner Tricia A and Shope David M
Bought by
Hapner Tricia A and Shope David M
Current Estimated Value
Home Financials for this Owner
Home Financials are based on the most recent Mortgage that was taken out on this home.
Original Mortgage
$88,500
Outstanding Balance
$27,294
Interest Rate
4.41%
Mortgage Type
New Conventional
Estimated Equity
$196,022
Purchase Details
Closed on
Mar 5, 2012
Sold by
Mapner Tricia A
Bought by
Mapner Tricia A and Shope David M
Purchase Details
Closed on
Dec 21, 2007
Sold by
Hamilton Kathleen M
Bought by
Hapner Tricia A
Home Financials for this Owner
Home Financials are based on the most recent Mortgage that was taken out on this home.
Original Mortgage
$101,200
Interest Rate
6.31%
Mortgage Type
FHA
Create a Home Valuation Report for This Property
The Home Valuation Report is an in-depth analysis detailing your home's value as well as a comparison with similar homes in the area
Home Values in the Area
Average Home Value in this Area
Purchase History
| Date | Buyer | Sale Price | Title Company |
|---|---|---|---|
| Hapner Tricia A | -- | None Available | |
| Mapner Tricia A | -- | None Available | |
| Hapner Tricia A | $102,000 | Attorney |
Source: Public Records
Mortgage History
| Date | Status | Borrower | Loan Amount |
|---|---|---|---|
| Open | Hapner Tricia A | $88,500 | |
| Previous Owner | Hapner Tricia A | $101,200 |
Source: Public Records
Tax History Compared to Growth
Tax History
| Year | Tax Paid | Tax Assessment Tax Assessment Total Assessment is a certain percentage of the fair market value that is determined by local assessors to be the total taxable value of land and additions on the property. | Land | Improvement |
|---|---|---|---|---|
| 2024 | $2,045 | $48,450 | $8,130 | $40,320 |
| 2023 | $2,035 | $48,450 | $8,130 | $40,320 |
| 2022 | $1,714 | $34,520 | $8,130 | $26,390 |
| 2021 | $1,513 | $33,410 | $8,130 | $25,280 |
| 2020 | $1,576 | $33,410 | $8,130 | $25,280 |
| 2019 | $2,328 | $31,790 | $8,890 | $22,900 |
| 2018 | $1,478 | $31,790 | $8,890 | $22,900 |
| 2017 | $1,490 | $31,790 | $8,890 | $22,900 |
| 2016 | $1,431 | $29,080 | $8,890 | $20,190 |
| 2015 | $1,423 | $29,080 | $8,890 | $20,190 |
| 2014 | $1,585 | $29,080 | $8,890 | $20,190 |
| 2013 | $1,585 | $34,500 | $8,890 | $25,610 |
Source: Public Records
Map
Nearby Homes
- 706 Mark Ave
- 155 Crowthers Dr
- 160 Crowthers Dr
- 1321 Cleveland Ave
- 748 Beeler Blvd
- 1252 Cleveland Ave
- 850 NW Washington Blvd
- 628 Beeler Blvd
- 1369 Alexander Dr
- 121 Random Dr
- 655 Devanshae Ct
- 1354 Alexander Dr
- 720 Shultz Dr
- 14 Justin Place
- 1319 Peregrine Way
- 721 Gordon Smith Blvd
- 4 Peregrine Way
- 1331 Peregrine Way
- 1421 Helma Ave
- 611 N Dick Ave
- 1740 NW Washington Blvd
- 1720 NW Washington Blvd
- 1750 NW Washington Blvd
- 1750 NW Washington Blvd
- 300 Hermay Dr
- 791 Sanders Dr
- 781 Sanders Dr
- 376 Hermay Dr
- 775 Sanders Dr
- 1760 NW Washington Blvd
- 1731 NW Washington Blvd
- 1741 NW Washington Blvd
- 765 Sanders Dr
- 1721 NW Washington Blvd
- 1751 NW Washington Blvd
- 1694 NW Washington Blvd
- 1770 NW Washington Blvd
- 232 Hermay Dr
- 367 Hermay Dr
- 1761 NW Washington Blvd