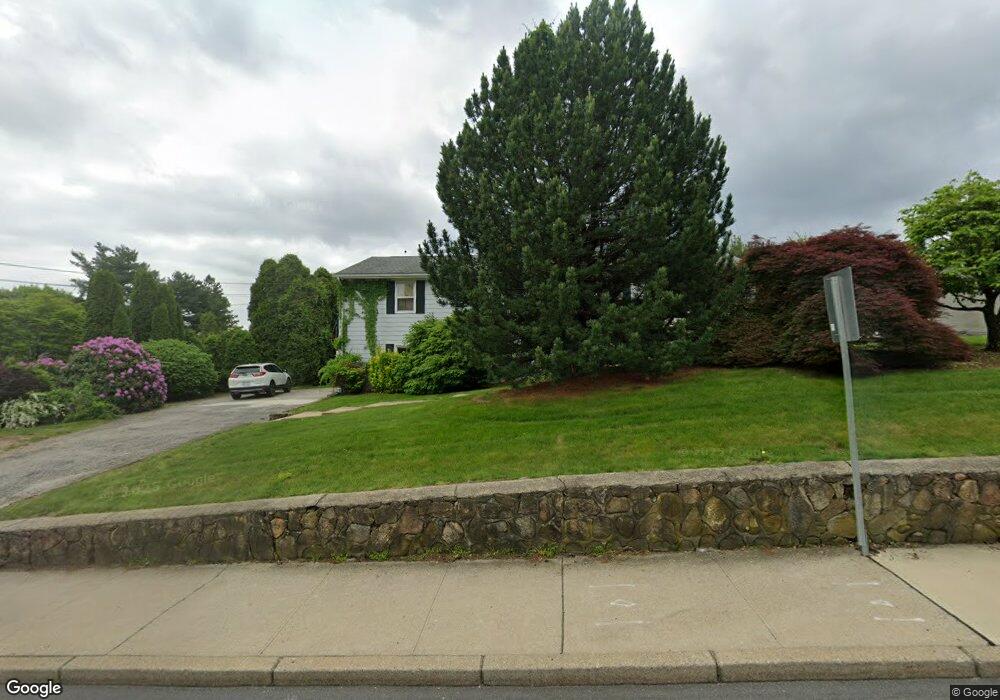
1730 Plainfield Pike Cranston, RI 02921
Thornton NeighborhoodEstimated Value: $499,000 - $645,000
4
Beds
2
Baths
2,352
Sq Ft
$244/Sq Ft
Est. Value
About This Home
This home is located at 1730 Plainfield Pike, Cranston, RI 02921 and is currently estimated at $573,627, approximately $243 per square foot. 1730 Plainfield Pike is a home located in Providence County with nearby schools including Stone Hill School, Western Hills Middle School, and Cranston High School West.
Ownership History
Date
Name
Owned For
Owner Type
Purchase Details
Closed on
Oct 7, 2011
Sold by
Cortes Rebeca V
Bought by
Agudelo Rebeca V
Current Estimated Value
Home Financials for this Owner
Home Financials are based on the most recent Mortgage that was taken out on this home.
Original Mortgage
$235,458
Interest Rate
4.2%
Mortgage Type
FHA
Purchase Details
Closed on
Apr 14, 2008
Sold by
Acme Concrete Form Co
Bought by
Cortes Rebecca V
Home Financials for this Owner
Home Financials are based on the most recent Mortgage that was taken out on this home.
Original Mortgage
$249,032
Interest Rate
6.3%
Mortgage Type
Purchase Money Mortgage
Purchase Details
Closed on
May 15, 2007
Sold by
Dynamic Enterprises
Bought by
Acme Concrete Form Co
Purchase Details
Closed on
Mar 28, 2005
Sold by
Dipippo Pasquale G
Bought by
Dynamic Builders Llc
Purchase Details
Closed on
Jan 21, 2005
Sold by
Pitocco Joseph and Pitocco Velia
Bought by
Dipippo Pasquale
Create a Home Valuation Report for This Property
The Home Valuation Report is an in-depth analysis detailing your home's value as well as a comparison with similar homes in the area
Home Values in the Area
Average Home Value in this Area
Purchase History
| Date | Buyer | Sale Price | Title Company |
|---|---|---|---|
| Agudelo Rebeca V | -- | -- | |
| Cortes Rebecca V | $251,000 | -- | |
| Acme Concrete Form Co | $510,000 | -- | |
| Dynamic Builders Llc | $250,000 | -- | |
| Dipippo Pasquale | $430,000 | -- |
Source: Public Records
Mortgage History
| Date | Status | Borrower | Loan Amount |
|---|---|---|---|
| Open | Dipippo Pasquale | $234,908 | |
| Closed | Dipippo Pasquale | $235,458 | |
| Previous Owner | Dipippo Pasquale | $249,032 |
Source: Public Records
Tax History Compared to Growth
Tax History
| Year | Tax Paid | Tax Assessment Tax Assessment Total Assessment is a certain percentage of the fair market value that is determined by local assessors to be the total taxable value of land and additions on the property. | Land | Improvement |
|---|---|---|---|---|
| 2025 | $5,762 | $415,100 | $99,800 | $315,300 |
| 2024 | $5,650 | $415,100 | $99,800 | $315,300 |
| 2023 | $5,695 | $301,300 | $68,800 | $232,500 |
| 2022 | $5,577 | $301,300 | $68,800 | $232,500 |
| 2021 | $5,423 | $301,300 | $68,800 | $232,500 |
| 2020 | $4,800 | $231,100 | $53,500 | $177,600 |
| 2019 | $4,800 | $231,100 | $53,500 | $177,600 |
| 2018 | $4,689 | $231,100 | $53,500 | $177,600 |
| 2017 | $3,707 | $161,600 | $19,100 | $142,500 |
| 2016 | $3,628 | $161,600 | $19,100 | $142,500 |
| 2015 | $3,628 | $161,600 | $19,100 | $142,500 |
| 2014 | $3,517 | $154,000 | $19,100 | $134,900 |
Source: Public Records
Map
Nearby Homes
- 118 Westfield Dr
- 27 Nardolillo St
- 1603 Plainfield Pike Unit D5
- 1603 Plainfield Pike Unit E2
- 26 Rachela St
- 17 Woodview Dr
- 11 Red Robin Rd
- 51 Stone Dr
- 134 Lake Garden Dr
- 20 Wild Berry Dr
- 27 Tartaglia St
- 41 Yeoman Ave
- 25 Loomis St
- 38 Mill St
- 9 Baker St
- 1448 Plainfield Pike
- 2 Robert Cir
- 26 Scituate Farms Dr
- 60 Harmony St
- 91 Curry Rd
- 0 Olivia Dr Unit 745226
- 0 Olivia Dr Unit 970205
- 0 Olivia Dr Unit 970207
- 0 Olivia Dr Unit 970211
- 0 Olivia Dr Unit 973109
- 8 Olivia Dr
- 1720 Plainfield Pike
- 1701 Plainfield Pike
- 11 Olivia Dr
- 14 Olivia Dr
- 1703 Plainfield Pike
- 1710 Plainfield Pike
- 15 Olivia Dr
- 1740 Plainfield Pike
- 1613 Plainfield Pike
- 71 Westfield Dr
- 63 Westfield Dr
- 83 Westfield Dr
- 59 Westfield Dr
- 1700 Plainfield Pike