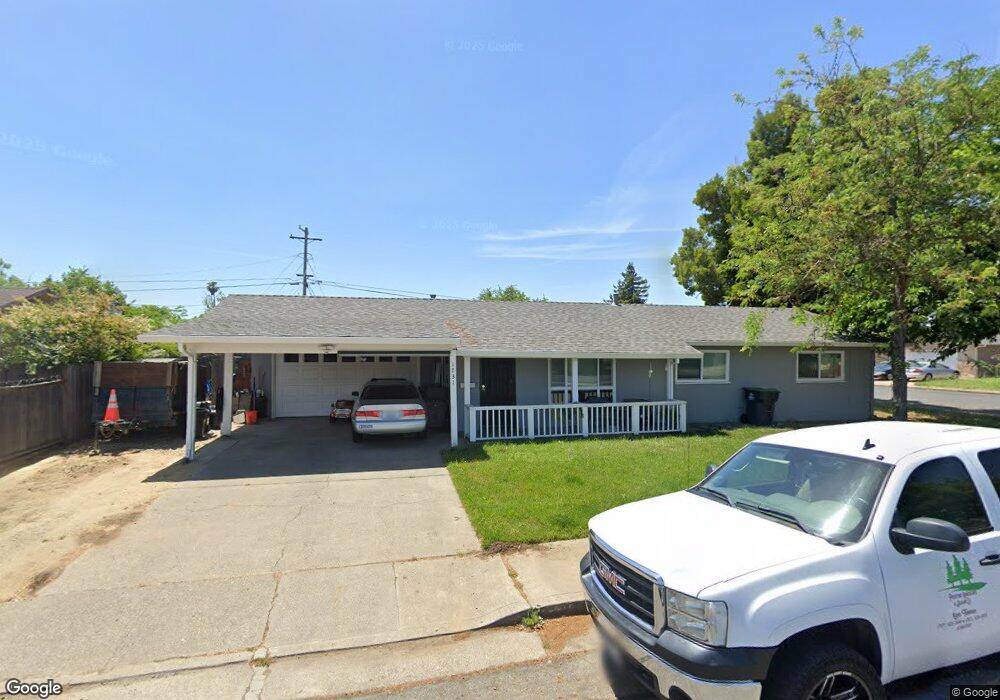
1731 New Hampshire St Fairfield, CA 94533
Estimated Value: $448,800 - $476,000
3
Beds
1
Bath
1,484
Sq Ft
$312/Sq Ft
Est. Value
About This Home
This home is located at 1731 New Hampshire St, Fairfield, CA 94533 and is currently estimated at $462,950, approximately $311 per square foot. 1731 New Hampshire St is a home located in Solano County with nearby schools including Fairview Elementary School, Crystal Middle School, and Armijo High School.
Ownership History
Date
Name
Owned For
Owner Type
Purchase Details
Closed on
Aug 15, 2017
Sold by
2012-C Property Holdings Llc
Bought by
Tah 2017-1 Borrower Llc
Current Estimated Value
Purchase Details
Closed on
Jan 2, 2013
Sold by
Deleon Jose G and Deleon Latasha
Bought by
2012-C Property Holdings Llc
Purchase Details
Closed on
Apr 10, 2007
Sold by
Hull Kirk W and Hull Melissa L
Bought by
Deleon Jose G and Deleon Latasha
Home Financials for this Owner
Home Financials are based on the most recent Mortgage that was taken out on this home.
Original Mortgage
$252,000
Interest Rate
6.11%
Mortgage Type
New Conventional
Purchase Details
Closed on
Jan 3, 2006
Sold by
Delorefice Todd and Delorefice Janel S
Bought by
Hull Kirk W and Hull Melissa L
Purchase Details
Closed on
Jul 13, 1995
Sold by
Dingman Edith and Wixon Dorothy
Bought by
Delorefice Todd and Delorefice Janel S
Purchase Details
Closed on
Jul 11, 1995
Sold by
Delorefice Todd and Delorefice Janel S
Bought by
Delorefice Todd and Delorefice Janel S
Create a Home Valuation Report for This Property
The Home Valuation Report is an in-depth analysis detailing your home's value as well as a comparison with similar homes in the area
Home Values in the Area
Average Home Value in this Area
Purchase History
| Date | Buyer | Sale Price | Title Company |
|---|---|---|---|
| Tah 2017-1 Borrower Llc | -- | None Available | |
| 2012-C Property Holdings Llc | $137,000 | Accommodation | |
| Deleon Jose G | $315,000 | Old Republic Title Company | |
| Hull Kirk W | $125,000 | None Available | |
| Delorefice Todd | $65,000 | Frontier Title Company | |
| Delorefice Todd | -- | -- |
Source: Public Records
Mortgage History
| Date | Status | Borrower | Loan Amount |
|---|---|---|---|
| Previous Owner | Deleon Jose G | $252,000 |
Source: Public Records
Tax History Compared to Growth
Tax History
| Year | Tax Paid | Tax Assessment Tax Assessment Total Assessment is a certain percentage of the fair market value that is determined by local assessors to be the total taxable value of land and additions on the property. | Land | Improvement |
|---|---|---|---|---|
| 2025 | $2,165 | $192,091 | $36,938 | $155,153 |
| 2024 | $2,165 | $188,325 | $36,214 | $152,111 |
| 2023 | $2,099 | $184,633 | $35,504 | $149,129 |
| 2022 | $2,074 | $181,013 | $34,808 | $146,205 |
| 2021 | $2,053 | $177,465 | $34,126 | $143,339 |
| 2020 | $2,006 | $175,647 | $33,777 | $141,870 |
| 2019 | $1,957 | $172,204 | $33,115 | $139,089 |
| 2018 | $2,020 | $168,828 | $32,466 | $136,362 |
| 2017 | $1,927 | $165,519 | $31,830 | $133,689 |
| 2016 | $1,907 | $162,274 | $31,206 | $131,068 |
| 2015 | $1,780 | $159,838 | $30,738 | $129,100 |
| 2014 | $1,764 | $156,708 | $30,136 | $126,572 |
Source: Public Records
Map
Nearby Homes
- 1731 Michigan St
- 1842 Minnesota St
- 1661 Minnesota St
- 1200 Truman St
- 1007 4th St
- 1443 Minnesota St
- 1042 Hayes St
- 2635 Alvarado Ct Unit 3
- 1412 Hawaii St
- 2724 Toland Dr
- 1625 Park Ln Unit 11
- 1032 Tyler St
- 1024 Tyler St
- 3109 Burbank Dr
- 1316 Lincoln St
- 1737 Kearny Ct
- 1737 Alford Dr
- 3418 Astoria Ct
- 2846 Owens St
- 1216 Lincoln St