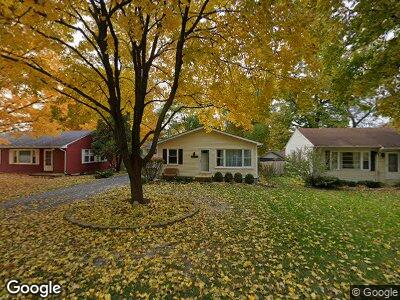
1731 S 4th Place Saint Charles, IL 60174
Southeast Saint Charles NeighborhoodEstimated Value: $332,000 - $353,560
3
Beds
3
Baths
1,232
Sq Ft
$276/Sq Ft
Est. Value
About This Home
This home is located at 1731 S 4th Place, Saint Charles, IL 60174 and is currently estimated at $340,140, approximately $276 per square foot. 1731 S 4th Place is a home located in Kane County with nearby schools including Munhall Elementary School, Wredling Middle School, and St Charles East High School.
Ownership History
Date
Name
Owned For
Owner Type
Purchase Details
Closed on
Jan 24, 2005
Sold by
Daughtry Michael E
Bought by
Daughtry Michael E and Daughtry Nola C
Current Estimated Value
Home Financials for this Owner
Home Financials are based on the most recent Mortgage that was taken out on this home.
Original Mortgage
$191,200
Interest Rate
7.25%
Mortgage Type
Stand Alone Refi Refinance Of Original Loan
Purchase Details
Closed on
Oct 22, 1998
Sold by
Hardel Nola C
Bought by
Daughtry Michael E
Home Financials for this Owner
Home Financials are based on the most recent Mortgage that was taken out on this home.
Original Mortgage
$92,000
Interest Rate
6.5%
Purchase Details
Closed on
Sep 23, 1994
Sold by
Hardel Geoffrey L
Bought by
Hardel Nola C
Create a Home Valuation Report for This Property
The Home Valuation Report is an in-depth analysis detailing your home's value as well as a comparison with similar homes in the area
Home Values in the Area
Average Home Value in this Area
Purchase History
| Date | Buyer | Sale Price | Title Company |
|---|---|---|---|
| Daughtry Michael E | -- | Chicago Title Insurance Comp | |
| Daughtry Michael E | -- | Stewart Title | |
| Hardel Nola C | -- | -- |
Source: Public Records
Mortgage History
| Date | Status | Borrower | Loan Amount |
|---|---|---|---|
| Open | Daughtry Michael E | $192,000 | |
| Closed | Daughtry Michael E | $208,800 | |
| Closed | Daughtry Michael E | $52,200 | |
| Closed | Daughtry Michael E | $191,200 | |
| Closed | Daughtry Michael E | $176,500 | |
| Closed | Daughtry Michael E | $35,000 | |
| Closed | Daughtry Michael E | $49,118 | |
| Closed | Daughtry Michael E | $25,000 | |
| Closed | Daughtry Michael E | $92,000 | |
| Closed | Daughtry Michael E | $47,800 |
Source: Public Records
Tax History Compared to Growth
Tax History
| Year | Tax Paid | Tax Assessment Tax Assessment Total Assessment is a certain percentage of the fair market value that is determined by local assessors to be the total taxable value of land and additions on the property. | Land | Improvement |
|---|---|---|---|---|
| 2023 | $5,602 | $87,027 | $24,998 | $62,029 |
| 2022 | $5,434 | $78,296 | $23,980 | $54,316 |
| 2021 | $5,190 | $74,632 | $22,858 | $51,774 |
| 2020 | $5,123 | $73,241 | $22,432 | $50,809 |
| 2019 | $4,803 | $69,193 | $21,988 | $47,205 |
| 2018 | $4,461 | $64,788 | $21,151 | $43,637 |
| 2017 | $4,321 | $62,573 | $20,428 | $42,145 |
| 2016 | $4,511 | $60,376 | $19,711 | $40,665 |
| 2015 | -- | $58,344 | $19,498 | $38,846 |
| 2014 | -- | $60,095 | $19,498 | $40,597 |
| 2013 | -- | $60,961 | $19,693 | $41,268 |
Source: Public Records
Map
Nearby Homes
- 1719 S 4th Place
- 425 Union Ave
- 839 N Bennett St
- 864 N Bennett St
- 1606 S 7th Ave
- 827 Elm Ave
- 1137 Fern Ave
- 1021 S 9th Ave
- 1015 S 9th Ave
- 1621 Jeanette Ave
- 1550 Ronzheimer Ave
- 1508 Independence Ave
- 1008 Pine St
- 1031 Pine St
- 806 S 9th Ave
- 111 Stevens St
- 96 Mckinley St
- 82 Gray St
- LOT 209 Austin Ave
- 1509 Williams Ave
- 1731 S 4th Place
- 1735 S 4th Place
- 1727 S 4th Place
- 1723 S 4th Place
- 1728 S 3rd Place
- 1726 S 3rd Place
- 306 Moore Ave
- 1724 S 3rd Place Unit 2
- 315 Moore Ave
- 1732 S 4th Place
- 1736 S 4th Place
- 1728 S 4th Place
- 221 Moore Ave
- 1720 S 3rd Place
- 1811 S 4th Place
- 1720 S 4th Place
- 1810 S 3rd Place
- 304 Moore Ave
- 1715 S 4th Place Unit 2
- 1716 S 3rd Place