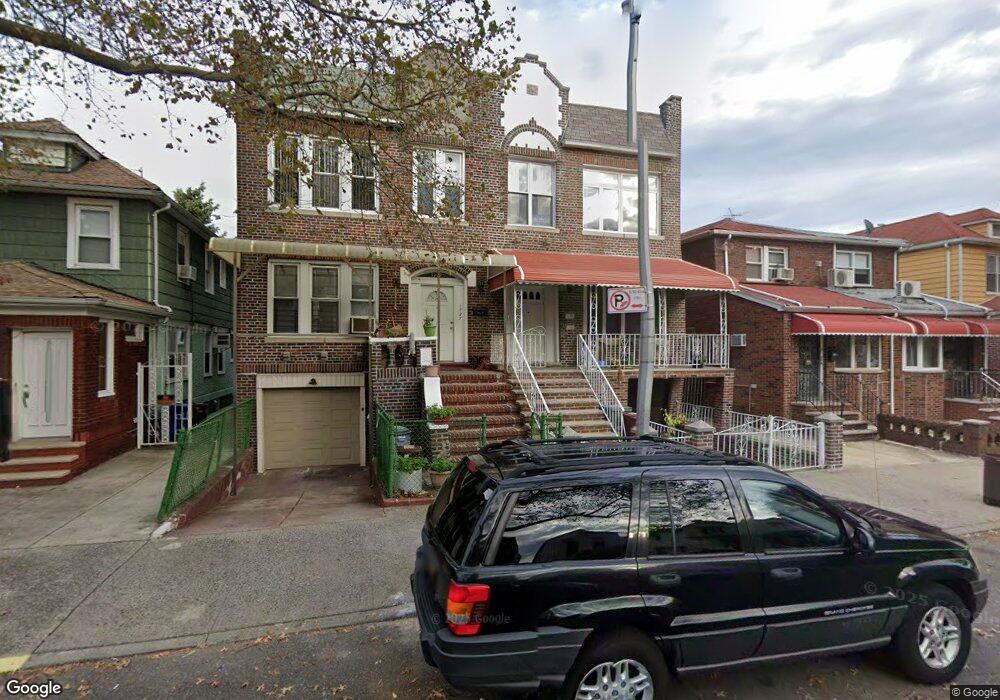
1731 W 2nd St Brooklyn, NY 11223
Gravesend NeighborhoodEstimated Value: $1,307,361 - $1,644,000
--
Bed
--
Bath
3,484
Sq Ft
$443/Sq Ft
Est. Value
About This Home
This home is located at 1731 W 2nd St, Brooklyn, NY 11223 and is currently estimated at $1,543,090, approximately $442 per square foot. 1731 W 2nd St is a home located in Kings County with nearby schools including P.S.177 The Marlboro, Is 228 David A Boody, and Success Academy Charter School - Bensonhurst.
Ownership History
Date
Name
Owned For
Owner Type
Purchase Details
Closed on
Dec 5, 2016
Sold by
Dai Mei C and Dai Ying Z
Bought by
Dai Mei C and Gomez Kevin S
Current Estimated Value
Home Financials for this Owner
Home Financials are based on the most recent Mortgage that was taken out on this home.
Original Mortgage
$500,000
Outstanding Balance
$403,990
Interest Rate
3.54%
Mortgage Type
New Conventional
Estimated Equity
$1,139,100
Purchase Details
Closed on
Sep 25, 2013
Sold by
Dai Mei Chang and Dai Ying Zi
Bought by
Dai Mei Chang and Dai Ying Zi
Purchase Details
Closed on
May 9, 2007
Sold by
Guida Leonardo and Guida Lucia
Bought by
Dai Mei Chang and Dai Ying Zi
Home Financials for this Owner
Home Financials are based on the most recent Mortgage that was taken out on this home.
Original Mortgage
$400,000
Interest Rate
6.27%
Mortgage Type
Purchase Money Mortgage
Create a Home Valuation Report for This Property
The Home Valuation Report is an in-depth analysis detailing your home's value as well as a comparison with similar homes in the area
Home Values in the Area
Average Home Value in this Area
Purchase History
| Date | Buyer | Sale Price | Title Company |
|---|---|---|---|
| Dai Mei C | -- | -- | |
| Dai Mei Chang | -- | -- | |
| Dai Mei Chang | -- | -- | |
| Dai Mei Chang | $715,000 | -- | |
| Dai Mei Chang | $715,000 | -- |
Source: Public Records
Mortgage History
| Date | Status | Borrower | Loan Amount |
|---|---|---|---|
| Open | Dai Mei C | $500,000 | |
| Previous Owner | Dai Mei Chang | $400,000 |
Source: Public Records
Tax History Compared to Growth
Tax History
| Year | Tax Paid | Tax Assessment Tax Assessment Total Assessment is a certain percentage of the fair market value that is determined by local assessors to be the total taxable value of land and additions on the property. | Land | Improvement |
|---|---|---|---|---|
| 2025 | $10,806 | $97,140 | $13,320 | $83,820 |
| 2024 | $10,806 | $80,040 | $13,320 | $66,720 |
| 2023 | $10,309 | $97,860 | $13,320 | $84,540 |
| 2022 | $9,696 | $103,860 | $13,320 | $90,540 |
| 2021 | $10,054 | $94,320 | $13,320 | $81,000 |
| 2020 | $4,972 | $78,840 | $13,320 | $65,520 |
| 2019 | $9,379 | $82,260 | $13,320 | $68,940 |
| 2018 | $8,325 | $42,301 | $8,809 | $33,492 |
| 2017 | $7,951 | $40,474 | $7,813 | $32,661 |
| 2016 | $7,649 | $39,812 | $8,027 | $31,785 |
| 2015 | $4,386 | $39,604 | $9,891 | $29,713 |
| 2014 | $4,386 | $37,364 | $11,200 | $26,164 |
Source: Public Records
Map
Nearby Homes
- 1728 W 2nd St
- 1640 W 1st St
- 1652 Dahill Rd
- 379 Kings Hwy Unit 2A
- 340 Avenue P
- 355 Kings Hwy Unit 5C
- 431 Kings Hwy
- 1632 W 4th St
- 412 Kings Hwy Unit 6C
- 339 Avenue P Unit 2B
- 339 Avenue P Unit 2A
- 380 Avenue P
- 1543 W 1st St Unit E8
- 1543 W 1st St Unit D1
- 1806 McDonald Ave
- 1734 E 2nd St
- 1560 W 2nd St
- 1721 W 6th St Unit 2A
- 1641 W 6th St
- 248 Avenue P
- 1733 W 2nd St
- 1727 W 2nd St
- 1735 W 2nd St
- 1725 W 2nd St
- 1737 W 2nd St
- 1721 W 2nd St
- 1741 W 2nd St
- 1719 W 2nd St
- 1730 W 1st St Unit 4
- 1726 W 1st St Unit 4
- 1743 W 2nd St
- 1743 W 2nd St Unit 3
- 1732 W 1st St Unit 4
- 1724 W 1st St Unit 4
- 1715 W 2nd St
- 1736 W 1st St Unit 4
- 1745 W 2nd St
- 1720 W 1st St Unit 4
- 1738 W 1st St Unit 4
- 1713 W 2nd St