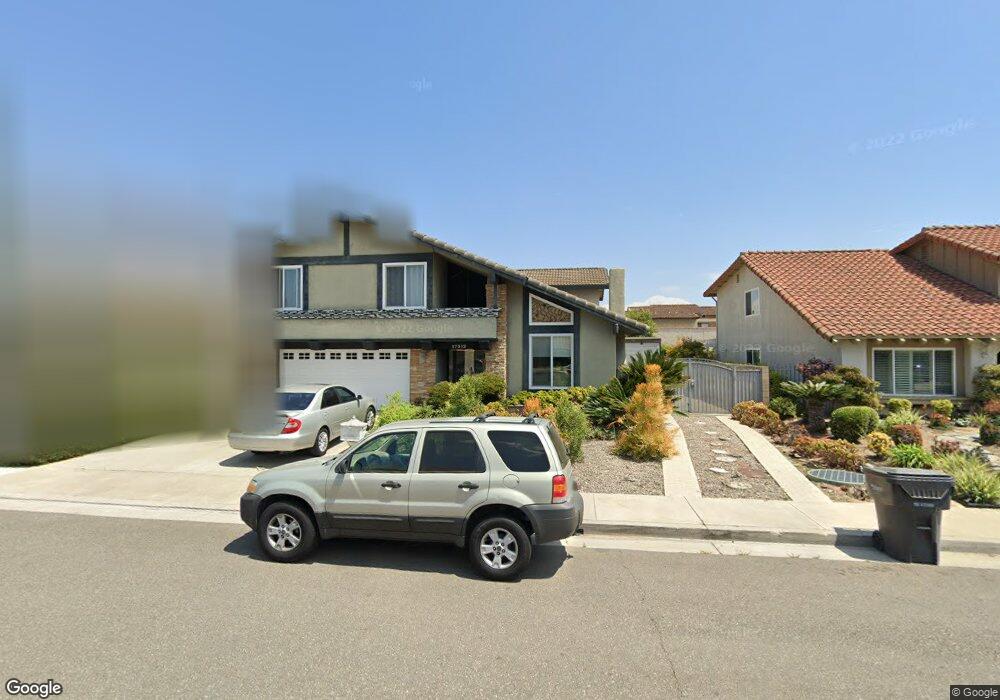
17312 Flame Tree Cir Fountain Valley, CA 92708
Estimated Value: $1,540,212 - $1,675,000
4
Beds
3
Baths
2,281
Sq Ft
$708/Sq Ft
Est. Value
About This Home
This home is located at 17312 Flame Tree Cir, Fountain Valley, CA 92708 and is currently estimated at $1,615,053, approximately $708 per square foot. 17312 Flame Tree Cir is a home located in Orange County with nearby schools including Plavan (Urbain H.) Elementary School, Masuda (Kazuo) Middle School, and Fountain Valley High School.
Ownership History
Date
Name
Owned For
Owner Type
Purchase Details
Closed on
Nov 27, 2019
Sold by
Luong Cindy K
Bought by
Luong Cindy K and The Cindy K Luong Revocable Tr
Current Estimated Value
Home Financials for this Owner
Home Financials are based on the most recent Mortgage that was taken out on this home.
Original Mortgage
$300,000
Outstanding Balance
$264,493
Interest Rate
3.6%
Estimated Equity
$1,350,560
Purchase Details
Closed on
Oct 19, 2015
Sold by
Luong Cindy Khanh
Bought by
Luong Cindy K and Cindy K Luong Revocable Trust
Purchase Details
Closed on
Sep 5, 2014
Sold by
The Luong Family Trust
Bought by
Luong Cindy Khanh
Purchase Details
Closed on
Sep 28, 1999
Sold by
Hong Luong Phucc and Hong Khanh Cindy
Bought by
Luong Phuoc Hong and Luong Cindy Khanh
Create a Home Valuation Report for This Property
The Home Valuation Report is an in-depth analysis detailing your home's value as well as a comparison with similar homes in the area
Home Values in the Area
Average Home Value in this Area
Purchase History
| Date | Buyer | Sale Price | Title Company |
|---|---|---|---|
| Luong Cindy K | -- | Old Republic Title Company | |
| Luong Cindy K | -- | Old Republic Title Company | |
| Luong Cindy K | -- | None Available | |
| Luong Cindy Khanh | -- | None Available | |
| Luong Phuoc Hong | -- | -- |
Source: Public Records
Mortgage History
| Date | Status | Borrower | Loan Amount |
|---|---|---|---|
| Open | Luong Cindy K | $300,000 |
Source: Public Records
Tax History Compared to Growth
Tax History
| Year | Tax Paid | Tax Assessment Tax Assessment Total Assessment is a certain percentage of the fair market value that is determined by local assessors to be the total taxable value of land and additions on the property. | Land | Improvement |
|---|---|---|---|---|
| 2025 | $7,315 | $662,318 | $423,579 | $238,739 |
| 2024 | $7,315 | $649,332 | $415,274 | $234,058 |
| 2023 | $7,142 | $636,600 | $407,131 | $229,469 |
| 2022 | $7,037 | $624,118 | $399,148 | $224,970 |
| 2021 | $6,901 | $611,881 | $391,322 | $220,559 |
| 2020 | $6,860 | $605,607 | $387,309 | $218,298 |
| 2019 | $6,718 | $593,733 | $379,715 | $214,018 |
| 2018 | $6,588 | $582,092 | $372,270 | $209,822 |
| 2017 | $6,483 | $570,679 | $364,971 | $205,708 |
| 2016 | $6,203 | $559,490 | $357,815 | $201,675 |
| 2015 | $6,107 | $551,086 | $352,440 | $198,646 |
| 2014 | $5,987 | $540,291 | $345,536 | $194,755 |
Source: Public Records
Map
Nearby Homes
- 17333 Brookhurst St Unit B7
- 17333 Brookhurst St Unit D6
- 17215 Buttonwood St
- 10322 Avenida Cinco de Mayo
- 16767 Madrone Cir
- 16806 Olive St
- 10452 Circulo de Juarez
- 17071 Ward St
- 10519 La Rosa Cir
- 9446 Gardenia Ave
- 10430 La Cebra Ave
- 259 Albatross Ln
- 718 Catalpa Ln
- 202 Pigeon Ln
- 109 Pigeon Ln
- 109 Pigeon Ln Unit 109
- 715 Catalpa Ln
- 809 Eucalyptus Ln
- 907 Ironwood Ln
- 16379 Shadbush St
- 17300 Flame Tree Cir
- 17324 Flame Tree Cir
- 17290 Flame Tree Cir
- 17336 Flame Tree Cir
- 17311 Flame Tree Cir
- 17321 Flame Tree Cir
- 17346 Flame Tree Cir
- 17278 Flame Tree Cir
- 17299 Flame Tree Cir
- 17333 Flame Tree Cir
- 17287 Flame Tree Cir
- 17266 Flame Tree Cir
- 17356 Flame Tree Cir
- 17275 Flame Tree Cir
- 17345 Flame Tree Cir
- 9797 La Tierra Cir
- 9798 El Portal Cir
- 17374 Winemast St
- 17355 Flame Tree Cir
- 17254 Flame Tree Cir