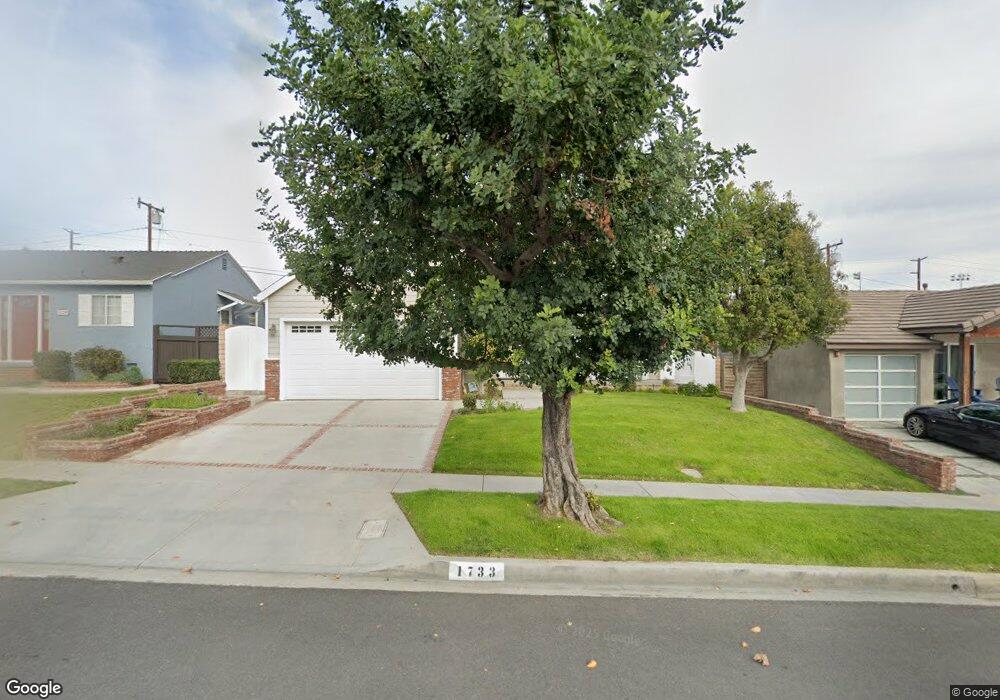
1733 23rd St Manhattan Beach, CA 90266
Estimated Value: $2,044,000 - $3,623,000
4
Beds
4
Baths
3,696
Sq Ft
$827/Sq Ft
Est. Value
About This Home
This home is located at 1733 23rd St, Manhattan Beach, CA 90266 and is currently estimated at $3,056,300, approximately $826 per square foot. 1733 23rd St is a home located in Los Angeles County with nearby schools including Meadows Avenue Elementary School, Manhattan Beach Middle School, and Mira Costa High School.
Ownership History
Date
Name
Owned For
Owner Type
Purchase Details
Closed on
Sep 12, 2002
Sold by
Hirai Junko
Bought by
Hirai Junko and Hirai Living Trust
Current Estimated Value
Purchase Details
Closed on
Sep 5, 2000
Sold by
Deley Robert D and Deley Brenda L
Bought by
Hirai Junko
Purchase Details
Closed on
Oct 19, 1999
Sold by
White Edward M
Bought by
White Jacquelyn E
Home Financials for this Owner
Home Financials are based on the most recent Mortgage that was taken out on this home.
Original Mortgage
$284,640
Interest Rate
3.45%
Purchase Details
Closed on
Oct 13, 1999
Sold by
Clark George L Sr Tr and George L Clark Sr Trust
Bought by
Deley Robert D and Deley Brenda L
Home Financials for this Owner
Home Financials are based on the most recent Mortgage that was taken out on this home.
Original Mortgage
$284,640
Interest Rate
3.45%
Purchase Details
Closed on
Jun 12, 1997
Sold by
Clark George L
Bought by
Clark George L and George L Clark Sr Trust
Create a Home Valuation Report for This Property
The Home Valuation Report is an in-depth analysis detailing your home's value as well as a comparison with similar homes in the area
Home Values in the Area
Average Home Value in this Area
Purchase History
| Date | Buyer | Sale Price | Title Company |
|---|---|---|---|
| Hirai Junko | -- | -- | |
| Hirai Junko | $425,000 | Southland Title Corporation | |
| White Jacquelyn E | -- | Southland Title Corporation | |
| Deley Robert D | $356,000 | Southland Title Corporation | |
| Clark George L | -- | -- | |
| Clark George L | -- | -- |
Source: Public Records
Mortgage History
| Date | Status | Borrower | Loan Amount |
|---|---|---|---|
| Previous Owner | Deley Robert D | $284,640 |
Source: Public Records
Tax History
| Year | Tax Paid | Tax Assessment Tax Assessment Total Assessment is a certain percentage of the fair market value that is determined by local assessors to be the total taxable value of land and additions on the property. | Land | Improvement |
|---|---|---|---|---|
| 2025 | $14,339 | $1,227,721 | $640,400 | $587,321 |
| 2024 | $14,339 | $1,203,649 | $627,844 | $575,805 |
| 2023 | $13,864 | $1,180,049 | $615,534 | $564,515 |
| 2022 | $13,630 | $1,156,912 | $603,465 | $553,447 |
| 2021 | $13,412 | $1,134,229 | $591,633 | $542,596 |
| 2019 | $13,060 | $1,100,589 | $574,086 | $526,503 |
| 2018 | $12,741 | $1,079,010 | $562,830 | $516,180 |
| 2016 | $11,734 | $1,037,113 | $540,976 | $496,137 |
| 2015 | $11,495 | $1,021,536 | $532,851 | $488,685 |
| 2014 | $11,341 | $1,001,527 | $522,414 | $479,113 |
Source: Public Records
Map
Nearby Homes
- 11 Cordoba Ct
- 5408 W 149th Place Unit 4
- 5485 Marine Ave
- 1819 11th St
- 1411 15th St
- 1228 23rd St
- 1450 Manhattan Beach Blvd
- 1827 9th St
- 1416 Manhattan Beach Blvd
- 28 Westport
- 1820 9th St
- 1816 9th St
- 1623 8th St
- 1612 Magnolia Ave
- 3310 Blossom Ln
- 3202 Green Ln
- 912 N Rowell Ave
- 1806 6th St
- 2016 Farrell Ave Unit B
- 2016 Farrell Ave Unit A
- 1737 23rd St
- 1729 23rd St
- 1750 Marine Ave
- 1746 Marine Ave
- 1725 23rd St
- 1741 23rd St
- 1756 Marine Ave
- 1740 Marine Ave
- 2208 Manzanita Ln
- 2209 Harkness St
- 1760 Marine Ave
- 1736 Marine Ave
- 1721 23rd St
- 2204 Manzanita Ln
- 2205 Harkness St
- 1730 Marine Ave
- 1801 23rd St
- 1717 23rd St
- 2209 Manzanita Ln
- 1800 Marine Ave
Your Personal Tour Guide
Ask me questions while you tour the home.