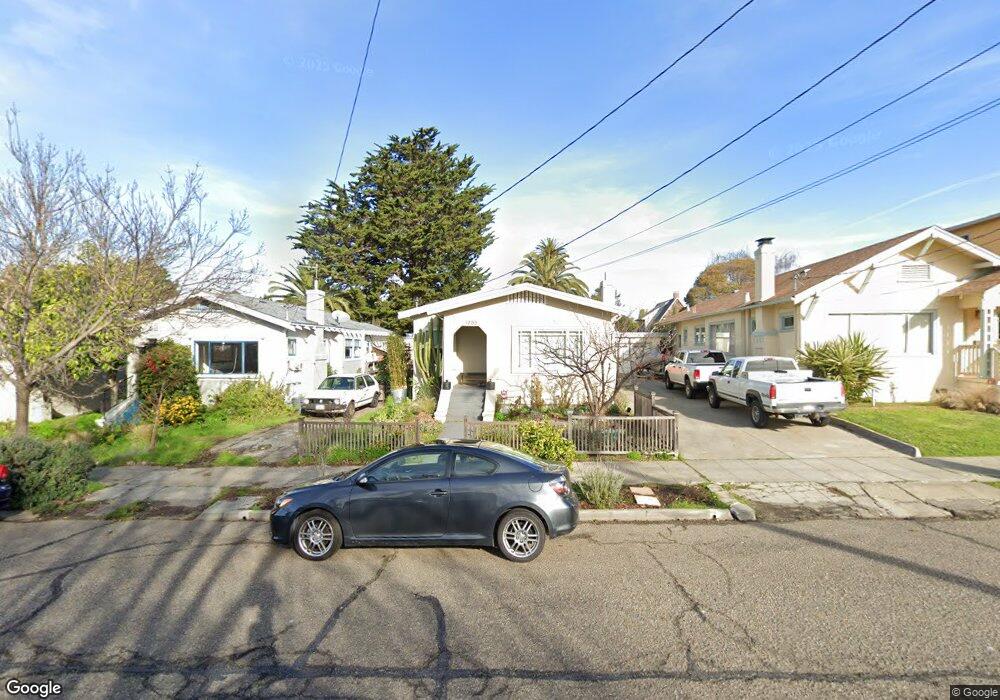
1733 Derby St Berkeley, CA 94703
South Berkeley NeighborhoodEstimated Value: $1,206,000 - $1,821,000
3
Beds
1
Bath
1,166
Sq Ft
$1,414/Sq Ft
Est. Value
About This Home
This home is located at 1733 Derby St, Berkeley, CA 94703 and is currently estimated at $1,648,163, approximately $1,413 per square foot. 1733 Derby St is a home located in Alameda County with nearby schools including Malcolm X Elementary School, Emerson Elementary School, and John Muir Elementary School.
Ownership History
Date
Name
Owned For
Owner Type
Purchase Details
Closed on
Jan 16, 2026
Sold by
Bercovici Jeffrey and Mostel Alyson
Bought by
Mostel-Bercovici Family Trust and Bercovici
Current Estimated Value
Purchase Details
Closed on
Oct 1, 2015
Sold by
Letourneau Ron H and Hall Meredith A
Bought by
Mostel Alyson and Bercovici Jeffrey
Home Financials for this Owner
Home Financials are based on the most recent Mortgage that was taken out on this home.
Original Mortgage
$625,500
Interest Rate
3.78%
Mortgage Type
New Conventional
Purchase Details
Closed on
Dec 30, 2008
Sold by
Letourneau Ron H
Bought by
Hall Meredith A and Letourneau Ron H
Purchase Details
Closed on
Mar 17, 2008
Sold by
Johnson Venus
Bought by
Letourneau Ron H
Purchase Details
Closed on
Dec 14, 2004
Sold by
Stringer Beulah
Bought by
Johnson Venos
Create a Home Valuation Report for This Property
The Home Valuation Report is an in-depth analysis detailing your home's value as well as a comparison with similar homes in the area
Home Values in the Area
Average Home Value in this Area
Purchase History
| Date | Buyer | Sale Price | Title Company |
|---|---|---|---|
| Mostel-Bercovici Family Trust | -- | None Listed On Document | |
| Mostel Alyson | -- | Placer Title | |
| Hall Meredith A | -- | None Available | |
| Letourneau Ron H | -- | Chicago Title Company | |
| Johnson Venos | -- | -- |
Source: Public Records
Mortgage History
| Date | Status | Borrower | Loan Amount |
|---|---|---|---|
| Previous Owner | Mostel Alyson | $625,500 |
Source: Public Records
Tax History
| Year | Tax Paid | Tax Assessment Tax Assessment Total Assessment is a certain percentage of the fair market value that is determined by local assessors to be the total taxable value of land and additions on the property. | Land | Improvement |
|---|---|---|---|---|
| 2025 | $18,060 | $1,354,335 | $414,319 | $947,016 |
| 2024 | $18,060 | $1,327,644 | $406,196 | $928,448 |
| 2023 | $17,715 | $1,308,481 | $398,233 | $910,248 |
| 2022 | $17,464 | $1,275,825 | $390,425 | $892,400 |
| 2021 | $17,548 | $1,250,674 | $382,770 | $874,904 |
| 2020 | $16,778 | $1,244,783 | $378,847 | $865,936 |
| 2019 | $16,305 | $1,220,380 | $371,420 | $848,960 |
| 2018 | $16,073 | $1,196,460 | $364,140 | $832,320 |
| 2017 | $15,527 | $1,173,000 | $357,000 | $816,000 |
| 2016 | $15,156 | $1,150,000 | $350,000 | $800,000 |
| 2015 | $6,089 | $398,904 | $119,671 | $279,233 |
| 2014 | $6,045 | $391,093 | $117,328 | $273,765 |
Source: Public Records
Map
Nearby Homes
- 2701 Grant St
- 1612 Carleton St
- 1612 Parker St
- 1901 Parker St Unit 3
- 1645 Dwight Way
- 1515 Derby St
- 1530 Stuart St
- 2018 Blake St
- 2750 Sacramento St
- 1450 Ward St
- 2758 Sacramento St
- 2926 Ellis St
- 2774 Sacramento St
- 2782 Sacramento St
- 2790 Sacramento St
- 1535 Julia St
- 1646 Ashby Ave
- 2350 Sacramento St
- 2922 Stanton St
- 2057 Emerson St
- 1727 Derby St
- 1735 Derby St
- 1737 Derby St
- 1725 Derby St
- 1739 Derby St
- 1730 Carleton St
- 1723 Derby St
- 1732 Carleton St
- 1734 Carleton St
- 1741 Derby St
- 1724 Carleton St
- 1736 Carleton St
- 1721 Derby St
- 2634 Grant St
- 1728 Derby St
- 1720 Carleton St
- 2632 Grant St
- 1747 Derby St
- 1719 Derby St
- 1730 Derby St Unit A
Your Personal Tour Guide
Ask me questions while you tour the home.