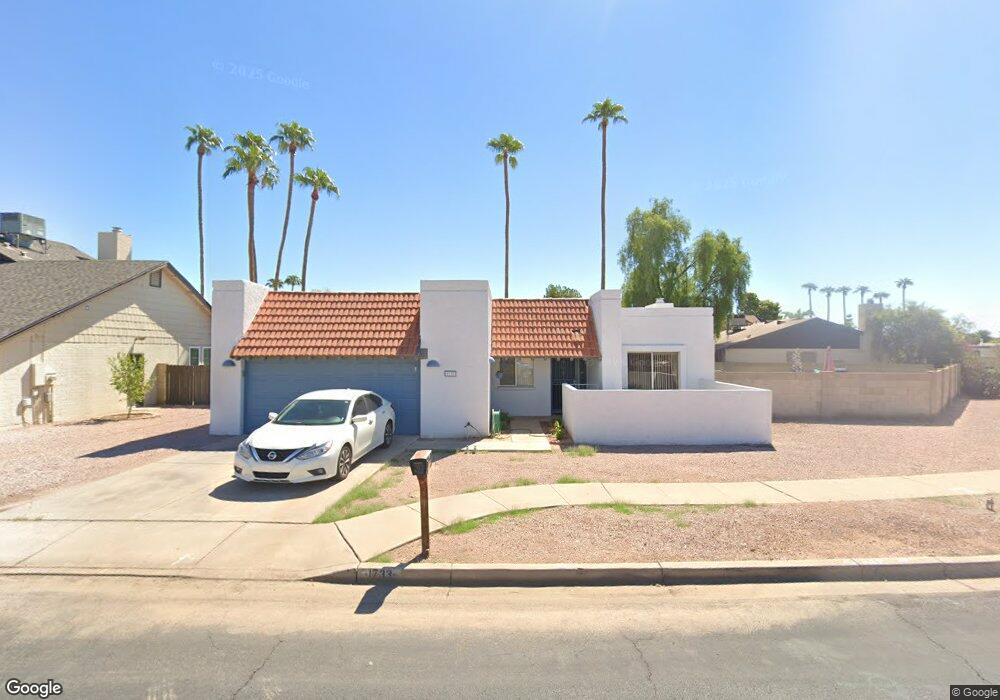
1733 S Sycamore Mesa, AZ 85202
Dobson NeighborhoodEstimated Value: $451,605 - $512,000
Studio
2
Baths
1,823
Sq Ft
$264/Sq Ft
Est. Value
About This Home
This home is located at 1733 S Sycamore, Mesa, AZ 85202 and is currently estimated at $480,401, approximately $263 per square foot. 1733 S Sycamore is a home located in Maricopa County with nearby schools including Franklin at Brimhall Elementary School, Washington Elementary School, and Franklin Accelerated Academy Jordan Campus.
Ownership History
Date
Name
Owned For
Owner Type
Purchase Details
Closed on
Feb 12, 2025
Sold by
Cordova Mark W
Bought by
Locaz03 Family Trust and Cordova
Current Estimated Value
Purchase Details
Closed on
Oct 2, 2001
Sold by
Thompson Donna Jean
Bought by
Cordova Mark W and Cordova Mark Wayne
Home Financials for this Owner
Home Financials are based on the most recent Mortgage that was taken out on this home.
Original Mortgage
$116,800
Interest Rate
6.91%
Mortgage Type
New Conventional
Purchase Details
Closed on
Jul 14, 2000
Sold by
Alexander Donna Thompson
Bought by
Thompson Donna Jean
Purchase Details
Closed on
Mar 20, 1995
Sold by
Bolin Arthur S
Bought by
Alexander Donna T
Create a Home Valuation Report for This Property
The Home Valuation Report is an in-depth analysis detailing your home's value as well as a comparison with similar homes in the area
Home Values in the Area
Average Home Value in this Area
Purchase History
| Date | Buyer | Sale Price | Title Company |
|---|---|---|---|
| Locaz03 Family Trust | -- | None Listed On Document | |
| Cordova Mark W | $146,000 | Security Title Agency | |
| Thompson Donna Jean | -- | -- | |
| Alexander Donna T | -- | -- |
Source: Public Records
Mortgage History
| Date | Status | Borrower | Loan Amount |
|---|---|---|---|
| Previous Owner | Cordova Mark W | $116,800 | |
| Closed | Cordova Mark W | $11,200 |
Source: Public Records
Tax History
| Year | Tax Paid | Tax Assessment Tax Assessment Total Assessment is a certain percentage of the fair market value that is determined by local assessors to be the total taxable value of land and additions on the property. | Land | Improvement |
|---|---|---|---|---|
| 2025 | $1,500 | $18,061 | -- | -- |
| 2024 | $1,516 | $17,201 | -- | -- |
| 2023 | $1,516 | $38,180 | $7,630 | $30,550 |
| 2022 | $1,483 | $28,000 | $5,600 | $22,400 |
| 2021 | $1,524 | $25,980 | $5,190 | $20,790 |
| 2020 | $1,503 | $23,430 | $4,680 | $18,750 |
| 2019 | $1,393 | $21,680 | $4,330 | $17,350 |
| 2018 | $1,330 | $19,900 | $3,980 | $15,920 |
| 2017 | $1,288 | $18,630 | $3,720 | $14,910 |
| 2016 | $1,265 | $18,430 | $3,680 | $14,750 |
| 2015 | $1,194 | $16,730 | $3,340 | $13,390 |
Source: Public Records
Map
Nearby Homes
- 1727 S Sycamore
- 1756 W Isabella Ave
- 1652 S Saguaro
- 1645 W Baseline Rd Unit 1058
- 1645 W Baseline Rd Unit 2072
- 1645 W Baseline Rd Unit 2084
- 1645 W Baseline Rd Unit 2002
- 1645 W Baseline Rd Unit 2050
- 1718 S Longmore Unit 13
- 1718 S Longmore Unit 68
- 1718 S Longmore Unit 34
- 1718 S Longmore Unit 67
- 1718 S Longmore Unit 75
- 2146 W Isabella Ave Unit 254
- 2146 W Isabella Ave Unit 122
- 2021 S Saguaro Cir Unit 18
- 2040 S Longmore Unit 72
- 2040 S Longmore Unit 55
- 2040 S Longmore Unit 75
- 2040 S Longmore Unit 33
- 1739 S Sycamore
- 1760 W Isabella Ave
- 1666 S Flint Cir
- 1730 S Sycamore
- 1743 S Sycamore
- 1734 S Sycamore
- 1738 S Sycamore
- 1740 S Sycamore
- 1660 S Flint Cir
- 1703 S Cholla
- 1752 W Isabella Ave Unit 3
- 1761 S Cholla
- 1665 S Flint Cir
- 1701 S Cholla
- 1719 S Sycamore
- 1761 W Isabella Ave
- 1719 S Cholla Unit 3
- 1757 W Isabella Ave
- 1765 W Isabella Ave Unit 3
- 1727 S Cholla
Your Personal Tour Guide
Ask me questions while you tour the home.