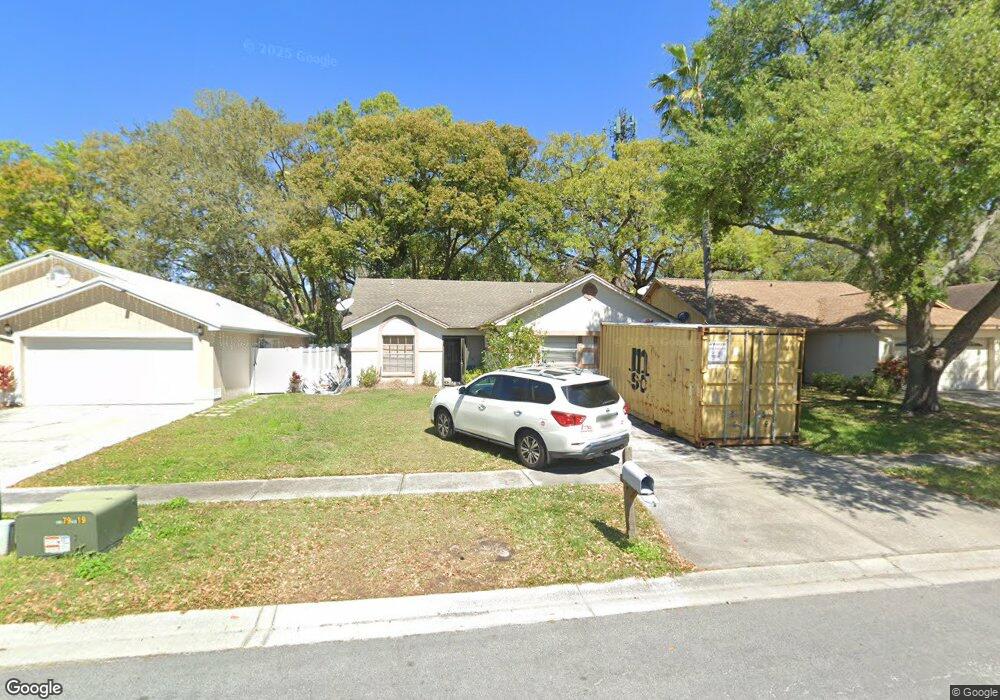
1734 Brandon Trace Ave Brandon, FL 33510
Estimated Value: $316,000 - $398,000
3
Beds
2
Baths
1,690
Sq Ft
$207/Sq Ft
Est. Value
About This Home
This home is located at 1734 Brandon Trace Ave, Brandon, FL 33510 and is currently estimated at $350,576, approximately $207 per square foot. 1734 Brandon Trace Ave is a home located in Hillsborough County with nearby schools including Schmidt Elementary School, Mann Middle School, and Armwood High School.
Ownership History
Date
Name
Owned For
Owner Type
Purchase Details
Closed on
Jun 3, 2024
Sold by
Gross Timothy R
Bought by
Gross Timothy R and Jones Tara L
Current Estimated Value
Purchase Details
Closed on
Jun 24, 2009
Sold by
Gross Timothy R and Gross Kathy J
Bought by
Gross Timothy R
Purchase Details
Closed on
Feb 18, 1999
Sold by
Tucker Michael A and Tucker A
Bought by
Gross Timothy R and Gross Kathy J
Purchase Details
Closed on
Oct 29, 1996
Sold by
Wicoff Monica L and Wicoff Jack
Bought by
Tucker Michael A and Tucker Maria A
Home Financials for this Owner
Home Financials are based on the most recent Mortgage that was taken out on this home.
Original Mortgage
$81,600
Interest Rate
8.28%
Mortgage Type
VA
Purchase Details
Closed on
Jul 21, 1993
Sold by
Bennett Martin Glenn
Bought by
Smith Monica Lyn
Purchase Details
Closed on
May 28, 1993
Sold by
Moser Marty W and Moser Sandra L
Bought by
Bennett Martin Glenn and Smith Monica Lyn
Create a Home Valuation Report for This Property
The Home Valuation Report is an in-depth analysis detailing your home's value as well as a comparison with similar homes in the area
Home Values in the Area
Average Home Value in this Area
Purchase History
| Date | Buyer | Sale Price | Title Company |
|---|---|---|---|
| Gross Timothy R | -- | None Listed On Document | |
| Gross Timothy R | -- | None Available | |
| Gross Timothy R | $80,200 | -- | |
| Tucker Michael A | $80,000 | -- | |
| Smith Monica Lyn | $35,000 | -- | |
| Bennett Martin Glenn | $76,100 | -- |
Source: Public Records
Mortgage History
| Date | Status | Borrower | Loan Amount |
|---|---|---|---|
| Previous Owner | Tucker Michael A | $82,000 | |
| Previous Owner | Tucker Michael A | $81,600 |
Source: Public Records
Tax History
| Year | Tax Paid | Tax Assessment Tax Assessment Total Assessment is a certain percentage of the fair market value that is determined by local assessors to be the total taxable value of land and additions on the property. | Land | Improvement |
|---|---|---|---|---|
| 2025 | $4,085 | $209,318 | $64,735 | $144,583 |
| 2024 | $4,085 | $205,387 | $58,850 | $146,537 |
| 2023 | $3,881 | $212,561 | $58,850 | $153,711 |
| 2022 | $3,567 | $204,931 | $58,850 | $146,081 |
| 2021 | $3,184 | $158,928 | $38,252 | $120,676 |
| 2020 | $2,828 | $133,276 | $30,896 | $102,380 |
| 2019 | $2,672 | $130,345 | $30,896 | $99,449 |
| 2018 | $2,434 | $114,452 | $0 | $0 |
| 2017 | $2,250 | $102,814 | $0 | $0 |
| 2016 | $2,202 | $99,465 | $0 | $0 |
| 2015 | $2,063 | $90,473 | $0 | $0 |
| 2014 | -- | $84,943 | $0 | $0 |
| 2013 | -- | $77,221 | $0 | $0 |
Source: Public Records
Map
Nearby Homes
- 2070 Sarah Louise Dr
- 1740 Lakeview Village Dr
- 2318 Hibiscus Ave
- 1930 Fruitridge St
- 1933 Fruitridge St
- 2110 Shady Point Ln
- 1708 Curry St
- 1952 Fruitridge St
- 11008 Black Swan Ct
- 1729 Lake Crest Ave
- 3401 High Hampton Cir
- 3403 High Hampton Cir
- 3506 High Hampton Cir
- 2769 Scarlet Bay Place
- 3808 Broad St
- 2761 Emory Sound Place
- 2764 Emory Sound Place
- 2106 Lennox Dale Ln
- 2760 Emory Sound Place
- 2138 Broadway View Ave
- 1736 Brandon Trace Ave
- 1735 Brandon Trace Ave
- 1738 Brandon Trace Ave
- 1739 Brandon Trace Ave
- 1732 Brandon Trace Ave
- 1740 Brandon Trace Ave
- 1730 Brandon Trace Ave
- 2026 Lori Ann St
- 1728 Brandon Trace Ave
- 2024 Lori Ann St
- 2023 Lori Ann St
- 1725 Brandon Trace Ave
- 1726 Brandon Trace Ave
- 2021 Lori Ann St
- 2022 Lori Ann St
- 1724 Brandon Trace Ave
- 2019 Lori Ann St
- 1723 Brandon Trace Ave
- 2020 Lori Ann St