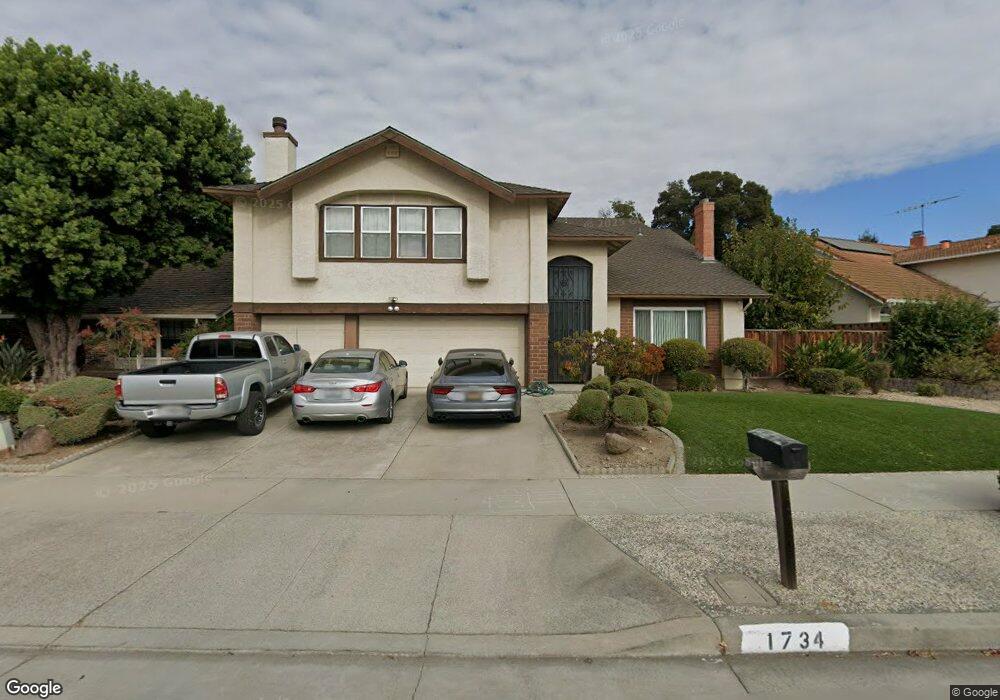
1734 Ridgetree Way San Jose, CA 95131
Brooktree NeighborhoodEstimated Value: $2,113,000 - $2,334,000
4
Beds
3
Baths
3,151
Sq Ft
$698/Sq Ft
Est. Value
About This Home
This home is located at 1734 Ridgetree Way, San Jose, CA 95131 and is currently estimated at $2,200,739, approximately $698 per square foot. 1734 Ridgetree Way is a home located in Santa Clara County with nearby schools including Brooktree Elementary School, Morrill Middle School, and Independence High School.
Ownership History
Date
Name
Owned For
Owner Type
Purchase Details
Closed on
Apr 23, 2019
Sold by
Imamura Brandon
Bought by
Imamura Brandon and Mamura Brenda Iem
Current Estimated Value
Purchase Details
Closed on
Dec 16, 2016
Sold by
The Children Of Tom W Chew & Lillian Won
Bought by
Imamura Brandon
Home Financials for this Owner
Home Financials are based on the most recent Mortgage that was taken out on this home.
Original Mortgage
$325,000
Outstanding Balance
$266,479
Interest Rate
4.03%
Mortgage Type
New Conventional
Estimated Equity
$1,934,260
Purchase Details
Closed on
Jun 16, 2010
Sold by
Thom Florence and Yamamoto Diana
Bought by
The Childred Of Tom W Chew & Lillian Won
Purchase Details
Closed on
May 31, 1994
Sold by
Chew Tom W and Chew Lillian W
Bought by
Chew Tom W and Chew Lillian W
Create a Home Valuation Report for This Property
The Home Valuation Report is an in-depth analysis detailing your home's value as well as a comparison with similar homes in the area
Home Values in the Area
Average Home Value in this Area
Purchase History
| Date | Buyer | Sale Price | Title Company |
|---|---|---|---|
| Imamura Brandon | -- | None Available | |
| Imamura Brandon | $675,000 | Chicago Title Company | |
| The Childred Of Tom W Chew & Lillian Won | -- | Old Republic Title Company | |
| Imamura Maryann | -- | Old Republic Title Company | |
| Yuen Alice | -- | Old Republic Title Company | |
| Kumagai Nellie | -- | Old Republic Title Company | |
| Chew Albert | -- | Old Republic Title Company | |
| Chew Raymond | -- | Old Republic Title Company | |
| Yamamoto Diana | -- | Old Republic Title Company | |
| Thom Florence | -- | Old Republic Title Company | |
| Chew Tom W | -- | -- |
Source: Public Records
Mortgage History
| Date | Status | Borrower | Loan Amount |
|---|---|---|---|
| Open | Imamura Brandon | $325,000 |
Source: Public Records
Tax History Compared to Growth
Tax History
| Year | Tax Paid | Tax Assessment Tax Assessment Total Assessment is a certain percentage of the fair market value that is determined by local assessors to be the total taxable value of land and additions on the property. | Land | Improvement |
|---|---|---|---|---|
| 2025 | $16,123 | $1,137,367 | $841,420 | $295,947 |
| 2024 | $16,123 | $1,115,067 | $824,922 | $290,145 |
| 2023 | $15,844 | $1,093,204 | $808,748 | $284,456 |
| 2022 | $15,766 | $1,071,770 | $792,891 | $278,879 |
| 2021 | $15,256 | $1,050,756 | $777,345 | $273,411 |
| 2020 | $14,745 | $1,039,983 | $769,375 | $270,608 |
| 2019 | $14,183 | $1,019,592 | $754,290 | $265,302 |
| 2018 | $13,804 | $688,500 | $447,474 | $241,026 |
| 2017 | $6,755 | $402,811 | $117,737 | $285,074 |
| 2016 | $6,476 | $394,914 | $115,429 | $279,485 |
| 2015 | $6,402 | $388,983 | $113,696 | $275,287 |
| 2014 | $5,416 | $381,364 | $111,469 | $269,895 |
Source: Public Records
Map
Nearby Homes
- 1693 Peachwood Dr
- 1690 Coraltree Place
- 2280 Zoria Cir
- 1827 Flickinger Ave
- 1599 Clampett Way
- 2210 Renfrew Ct
- 2200 Beech Cir
- 1898 Anne Marie Ct
- 2158 Capitol Park Ct
- 2625 Autumnvale Dr
- 2129 Doxey Dr
- 2790 Longford Dr
- 2924 Via Encinitas
- 2075 Lakewood Dr
- 1332 Cabrillo Ave
- 1982 Plaza Montez
- 1879 Passage St
- 1997 Lowney Way
- Odin Plan at Parkside West
- Asra Plan at Parkside West
- 1728 Ridgetree Way
- 1740 Ridgetree Way
- 1724 Ridgetree Way
- 1746 Ridgetree Way
- 1741 Ridgetree Way
- 1720 Ridgetree Way
- 1735 Ridgetree Way
- 1747 Ridgetree Way
- 1752 Ridgetree Way
- 1753 Ridgetree Way
- 2354 Shade Tree Ln
- 1716 Ridgetree Way
- 2349 Shade Tree Ln
- 1758 Ridgetree Way
- 1759 Ridgetree Way
- 2368 Yesler Ct
- 2358 Hamlet Ct
- 2350 Shade Tree Ln
- 2352 Hamlet Ct
- 1712 Ridgetree Way