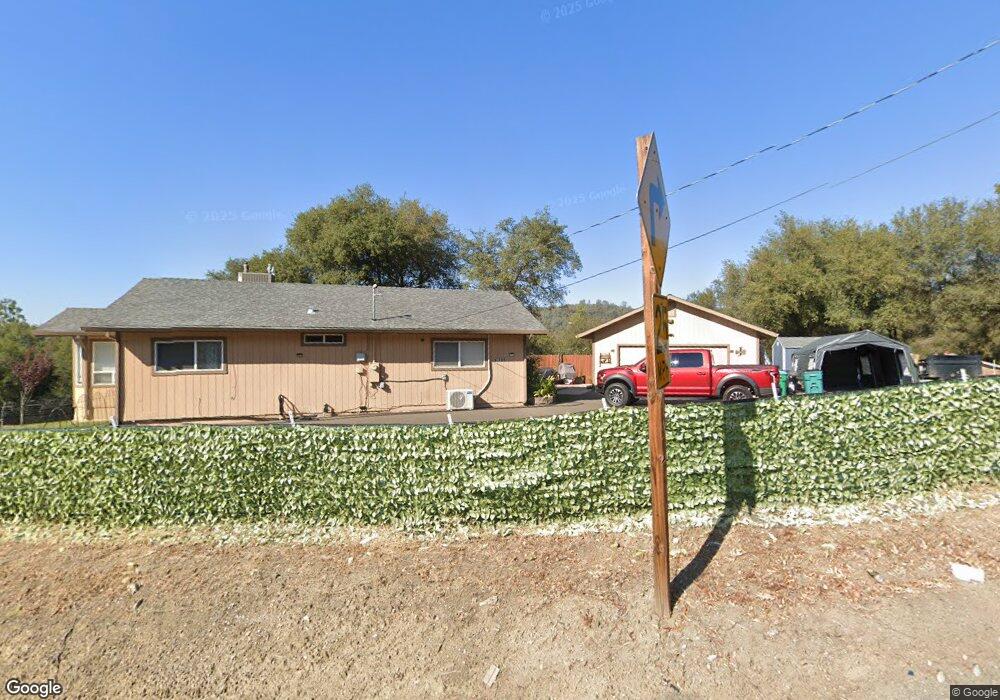
1735 Cold Springs Rd Placerville, CA 95667
Estimated Value: $334,000 - $537,000
2
Beds
1
Bath
1,008
Sq Ft
$423/Sq Ft
Est. Value
About This Home
This home is located at 1735 Cold Springs Rd, Placerville, CA 95667 and is currently estimated at $426,059, approximately $422 per square foot. 1735 Cold Springs Rd is a home located in El Dorado County with nearby schools including Sutter's Mill Elementary School, Gold Trail School, and El Dorado High School.
Ownership History
Date
Name
Owned For
Owner Type
Purchase Details
Closed on
May 24, 2002
Sold by
Funston Mark
Bought by
Jimenez Saul and Jimenez Angelica
Current Estimated Value
Home Financials for this Owner
Home Financials are based on the most recent Mortgage that was taken out on this home.
Original Mortgage
$184,250
Outstanding Balance
$77,583
Interest Rate
6.89%
Estimated Equity
$348,476
Purchase Details
Closed on
Dec 14, 2000
Sold by
Walker Conroy Janet
Bought by
Funston Mark
Purchase Details
Closed on
Jan 20, 1999
Sold by
Williams Elaine R
Bought by
Tucker Soraya B
Purchase Details
Closed on
Jul 23, 1998
Sold by
Barrett Judith Tr and Williams Rev 1992 Trust
Bought by
Williams Elaine Rr
Home Financials for this Owner
Home Financials are based on the most recent Mortgage that was taken out on this home.
Original Mortgage
$33,000
Interest Rate
6.88%
Create a Home Valuation Report for This Property
The Home Valuation Report is an in-depth analysis detailing your home's value as well as a comparison with similar homes in the area
Home Values in the Area
Average Home Value in this Area
Purchase History
| Date | Buyer | Sale Price | Title Company |
|---|---|---|---|
| Jimenez Saul | $196,000 | Fidelity National Title Co | |
| Funston Mark | $68,000 | Fidelity National Title | |
| Tucker Soraya B | -- | -- | |
| Williams Elaine Rr | -- | First American Title Co |
Source: Public Records
Mortgage History
| Date | Status | Borrower | Loan Amount |
|---|---|---|---|
| Open | Jimenez Saul | $184,250 | |
| Previous Owner | Williams Elaine Rr | $33,000 |
Source: Public Records
Tax History
| Year | Tax Paid | Tax Assessment Tax Assessment Total Assessment is a certain percentage of the fair market value that is determined by local assessors to be the total taxable value of land and additions on the property. | Land | Improvement |
|---|---|---|---|---|
| 2025 | $3,243 | $321,354 | $112,259 | $209,095 |
| 2024 | $3,243 | $314,163 | $110,058 | $204,105 |
| 2023 | $3,169 | $307,155 | $107,900 | $199,255 |
| 2022 | $3,088 | $297,825 | $105,785 | $192,040 |
| 2021 | $2,788 | $267,476 | $103,711 | $163,765 |
| 2020 | $2,750 | $264,734 | $102,648 | $162,086 |
| 2019 | $2,708 | $259,544 | $100,636 | $158,908 |
| 2018 | $2,632 | $254,456 | $98,663 | $155,793 |
| 2017 | $2,587 | $249,468 | $96,729 | $152,739 |
| 2016 | $2,549 | $244,578 | $94,833 | $149,745 |
| 2015 | $2,463 | $240,906 | $93,409 | $147,497 |
| 2014 | $2,463 | $236,188 | $91,580 | $144,608 |
Source: Public Records
Map
Nearby Homes
- 1525 Cold Springs Rd Unit 82
- 1525 Cold Springs Rd Unit 37
- 1525 Cold Springs Rd Unit 80
- 1525 Cold Springs Rd Unit 67
- 1525 Cold Springs Rd Unit 92
- 1525 Cold Springs Rd Unit 55
- 1525 Cold Springs Rd Unit 97
- 1525 Cold Springs Rd Unit 48
- 1525 Cold Springs Rd Unit 63
- 0 Browns Rd Unit 225114992
- 1244 Cold Springs Rd
- 3031 Rising Hill Ct
- 2236 Cold Springs Rd
- 2249 Cold Springs Rd
- 2822 Winesap Cir
- 2840 Winesap Cir
- 1140 Cold Springs Rd
- 2320 Pintail Ln
- 1095 Cold Springs Rd
- 3270 Stagecoach Rd
- 1640 Paso Diablo Rd
- 1720 Cold Springs Rd
- 1701 Cold Springs Rd
- 1640 Sally Ln
- 1621 Sally Ln
- 1675 Cold Springs Rd
- 1620 Sally Ln
- 1621 Paso Diablo Rd
- 1750 Cold Springs Rd
- 1620 Paso Diablo Rd
- 1690 Cold Springs Rd
- 1801 Cold Springs Rd
- 1660 Cold Springs Rd
- 1627 Cold Springs Rd
- 1571 Paso Diablo Rd
- 1628 Cold Springs Rd
- 6741 Browns Rd
- 6640 Richard Ave
- 6722 Browns Rd
- 6645 Richard Ave
Your Personal Tour Guide
Ask me questions while you tour the home.