Estimated Value: $520,000 - $569,000
4
Beds
4
Baths
3,230
Sq Ft
$167/Sq Ft
Est. Value
About This Home
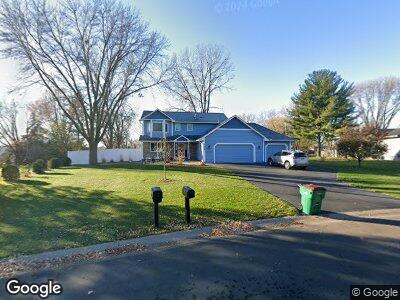
This home is located at 17351 88th Ave N, Osseo, MN 55311 and is currently estimated at $537,852, approximately $166 per square foot. 17351 88th Ave N is a home located in Hennepin County with nearby schools including Rush Creek Elementary School, Maple Grove Middle School, and Maple Grove Senior High School.
Ownership History
Date
Name
Owned For
Owner Type
Purchase Details
Closed on
Oct 31, 2019
Sold by
Robison Josephine K and Robison Mark W
Bought by
Parks Megan and Parks Brian
Current Estimated Value
Home Financials for this Owner
Home Financials are based on the most recent Mortgage that was taken out on this home.
Original Mortgage
$366,750
Outstanding Balance
$326,412
Interest Rate
3.65%
Mortgage Type
New Conventional
Estimated Equity
$211,440
Purchase Details
Closed on
Oct 19, 2011
Sold by
Dykoff David A and Eastman Dykhoff Kristin M
Bought by
Robison Mark W and Robison Josephine K
Home Financials for this Owner
Home Financials are based on the most recent Mortgage that was taken out on this home.
Original Mortgage
$274,075
Interest Rate
4.02%
Mortgage Type
New Conventional
Purchase Details
Closed on
Jan 23, 2007
Sold by
Eastman David J and Eastman Pamela A
Bought by
Eastman Kristin M
Create a Home Valuation Report for This Property
The Home Valuation Report is an in-depth analysis detailing your home's value as well as a comparison with similar homes in the area
Home Values in the Area
Average Home Value in this Area
Purchase History
| Date | Buyer | Sale Price | Title Company |
|---|---|---|---|
| Parks Megan | $407,500 | Stewart Ttl Relocation Svcs | |
| Robison Mark W | $288,500 | Stewart Title Guaranty Compa | |
| Eastman Kristin M | $250,040 | -- |
Source: Public Records
Mortgage History
| Date | Status | Borrower | Loan Amount |
|---|---|---|---|
| Open | Parks Megan | $366,750 | |
| Previous Owner | Robison Mark W | $274,075 |
Source: Public Records
Tax History Compared to Growth
Tax History
| Year | Tax Paid | Tax Assessment Tax Assessment Total Assessment is a certain percentage of the fair market value that is determined by local assessors to be the total taxable value of land and additions on the property. | Land | Improvement |
|---|---|---|---|---|
| 2023 | $5,960 | $506,800 | $134,000 | $372,800 |
| 2022 | $4,982 | $494,900 | $114,000 | $380,900 |
| 2021 | $4,802 | $410,500 | $88,500 | $322,000 |
| 2020 | $4,977 | $389,100 | $76,200 | $312,900 |
| 2019 | $4,822 | $385,000 | $86,100 | $298,900 |
| 2018 | $4,678 | $354,400 | $73,100 | $281,300 |
| 2017 | $4,643 | $323,600 | $68,500 | $255,100 |
| 2016 | $4,467 | $308,400 | $62,500 | $245,900 |
| 2015 | $4,729 | $316,700 | $77,500 | $239,200 |
| 2014 | -- | $292,100 | $77,500 | $214,600 |
Source: Public Records
Map
Nearby Homes
- 17055 89th Place N
- 17388 90th Ave N
- 8782 Narcissus Ln N
- 9038 Merrimac Ln N
- 10154 Peony Ln N
- 10172 Peony Ln N
- 8803 Everest Ln N
- 8683 Peony Ln N
- 9033 Peony Ln N
- 9177 Merrimac Ln N
- 9063 Holly Ln N
- 16938 Weaver Lake Dr
- 16654 89th Ave N
- 9105 Holly Ln N
- 9209 Merrimac Ln N
- 9277 Inland Ln N
- 8982 Comstock Ln N
- 9010 Comstock Ln N
- 8446 Shadyview Ln N
- 8455 Shadyview Ln N
- 17351 88th Ave N
- 8831 Kimberly Ln N
- 17354 Weaver Lake Dr
- 17281 88th Ave N
- 17302 Weaver Lake Dr
- 17310 88th Ave N
- 8861 Kimberly Ln N
- 17376 Weaver Lake Dr
- 17310 88th Ave N
- 17310 88th Ave N
- 17278 Weaver Lake Dr
- 17280 88th Ave N
- 17261 88th Ave N
- 8881 Kimberly Ln N
- 17404 Weaver Lake Dr
- 17260 88th Ave N
- 17327 Weaver Lake Dr
- 17355 Weaver Lake Dr
- 8840 Lawndale Ln N
- 8820 Lawndale Ln N