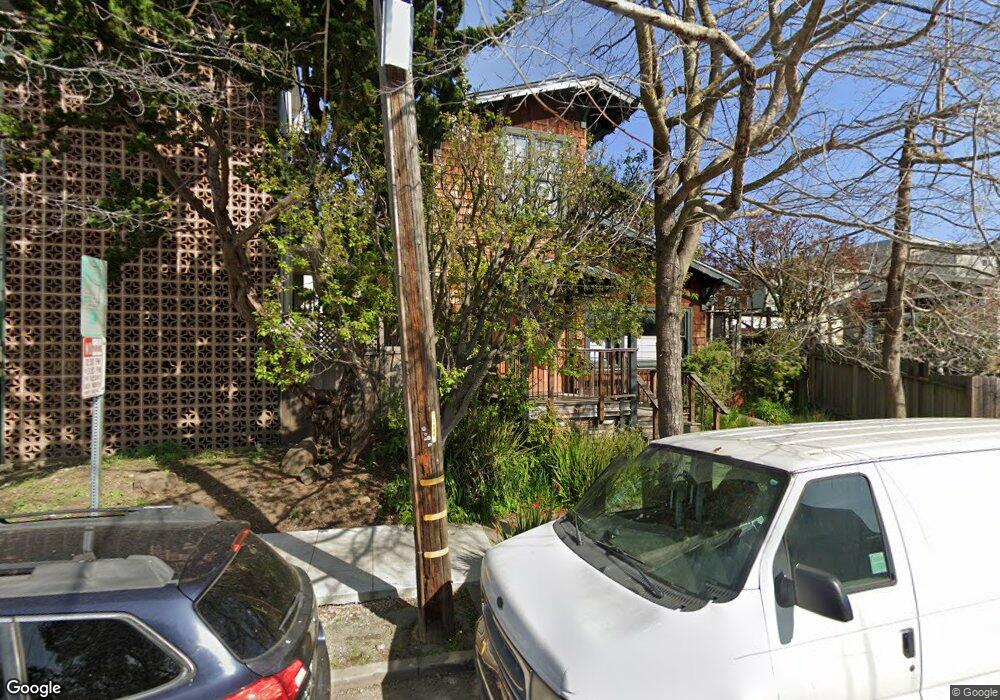
1737 Grant St Berkeley, CA 94703
North Berkeley NeighborhoodEstimated Value: $1,518,000 - $1,901,000
4
Beds
2
Baths
1,992
Sq Ft
$864/Sq Ft
Est. Value
About This Home
This home is located at 1737 Grant St, Berkeley, CA 94703 and is currently estimated at $1,720,929, approximately $863 per square foot. 1737 Grant St is a home located in Alameda County with nearby schools including Berkeley Arts Magnet at Whittier School, Washington Elementary School, and Oxford Elementary School.
Ownership History
Date
Name
Owned For
Owner Type
Purchase Details
Closed on
Nov 16, 2021
Sold by
Nordman Bruce and Nordman Teresa
Bought by
Nordman Provenzano Family Trust and Nordman
Current Estimated Value
Purchase Details
Closed on
Oct 29, 1993
Sold by
Nordman Robert Guy and Nordman Elisabeth Edson
Bought by
Nordman Bruce
Home Financials for this Owner
Home Financials are based on the most recent Mortgage that was taken out on this home.
Original Mortgage
$121,600
Interest Rate
6.91%
Create a Home Valuation Report for This Property
The Home Valuation Report is an in-depth analysis detailing your home's value as well as a comparison with similar homes in the area
Home Values in the Area
Average Home Value in this Area
Purchase History
| Date | Buyer | Sale Price | Title Company |
|---|---|---|---|
| Nordman Provenzano Family Trust | -- | Shelton Peter | |
| Nordman Bruce | $41,000 | -- |
Source: Public Records
Mortgage History
| Date | Status | Borrower | Loan Amount |
|---|---|---|---|
| Previous Owner | Nordman Bruce | $121,600 |
Source: Public Records
Tax History
| Year | Tax Paid | Tax Assessment Tax Assessment Total Assessment is a certain percentage of the fair market value that is determined by local assessors to be the total taxable value of land and additions on the property. | Land | Improvement |
|---|---|---|---|---|
| 2025 | $9,221 | $437,723 | $118,669 | $326,054 |
| 2024 | $9,221 | $429,005 | $116,343 | $319,662 |
| 2023 | $8,942 | $427,457 | $114,062 | $313,395 |
| 2022 | $8,662 | $412,076 | $111,825 | $307,251 |
| 2021 | $8,647 | $403,860 | $109,633 | $301,227 |
| 2020 | $8,061 | $406,648 | $108,509 | $298,139 |
| 2019 | $7,606 | $398,677 | $106,382 | $292,295 |
| 2018 | $7,442 | $390,861 | $104,296 | $286,565 |
| 2017 | $7,164 | $383,198 | $102,251 | $280,947 |
| 2016 | $6,837 | $375,687 | $100,247 | $275,440 |
| 2015 | $6,728 | $370,045 | $98,741 | $271,304 |
| 2014 | $6,640 | $362,799 | $96,808 | $265,991 |
Source: Public Records
Map
Nearby Homes
- 1625 Martin Luther King jr Way
- 1808 Cedar St
- 2015 Delaware St
- 2015 Delaware St Unit A
- 1609 Bonita Ave Unit 5
- 1610 Milvia St
- 2218 -2222 Grant St
- 1815 Vine St
- 1813 Sacramento St
- 1436 Delaware St
- 1425 Martin Luther King jr Way
- 1564 Sacramento St
- 2118 California St
- 1682 Oxford St
- 1411 Hearst Ave Unit 2
- 2201 Virginia St Unit 2
- 1739 Spruce St
- 1444 Walnut St
- 1529 Ada St
- 1519 Oxford St Unit E
- 1733 Grant St
- 1805 Delaware St
- 1809 Delaware St
- 1801 Delaware St
- 1729 Grant St
- 1811 Delaware St
- 1812 Francisco St
- 1810 Francisco St
- 1815 Delaware St
- 1725 Grant St
- 1816 Francisco St
- 1817 Delaware St
- 1742 Grant St
- 1751 Delaware St
- 1726 Grant St
- 1740 Grant St
- 1732 Grant St
- 1820 Francisco St
- 1746 Francisco St
- 1801 Grant St
Your Personal Tour Guide
Ask me questions while you tour the home.