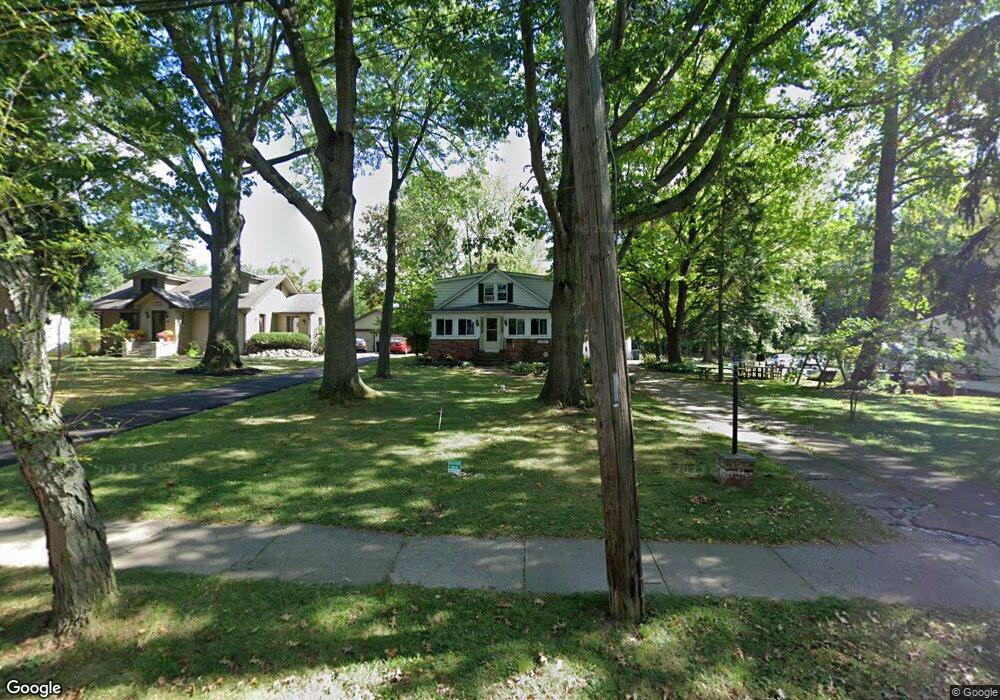
1737 Sunview Rd Cleveland, OH 44124
Estimated Value: $225,171 - $273,000
3
Beds
1
Bath
1,568
Sq Ft
$159/Sq Ft
Est. Value
About This Home
This home is located at 1737 Sunview Rd, Cleveland, OH 44124 and is currently estimated at $248,543, approximately $158 per square foot. 1737 Sunview Rd is a home located in Cuyahoga County with nearby schools including Sunview Elementary School, Greenview Upper Elementary School, and Memorial Junior High School.
Ownership History
Date
Name
Owned For
Owner Type
Purchase Details
Closed on
Nov 28, 2001
Sold by
Trepal John E
Bought by
Trepal John E and Trepal Susan A
Current Estimated Value
Purchase Details
Closed on
Feb 5, 1998
Sold by
Trepal John E
Bought by
Trepal John E
Home Financials for this Owner
Home Financials are based on the most recent Mortgage that was taken out on this home.
Original Mortgage
$119,800
Outstanding Balance
$21,434
Interest Rate
7.12%
Estimated Equity
$227,109
Purchase Details
Closed on
Jul 7, 1997
Sold by
Albano Merita
Bought by
Trepal John E
Home Financials for this Owner
Home Financials are based on the most recent Mortgage that was taken out on this home.
Original Mortgage
$119,900
Interest Rate
8.01%
Mortgage Type
New Conventional
Purchase Details
Closed on
Jan 1, 1987
Bought by
Albano Merita
Purchase Details
Closed on
Aug 13, 1986
Bought by
Grasson Walter
Create a Home Valuation Report for This Property
The Home Valuation Report is an in-depth analysis detailing your home's value as well as a comparison with similar homes in the area
Home Values in the Area
Average Home Value in this Area
Purchase History
| Date | Buyer | Sale Price | Title Company |
|---|---|---|---|
| Trepal John E | -- | -- | |
| Trepal John E | -- | -- | |
| Trepal John E | $149,900 | -- | |
| Albano Merita | -- | -- | |
| Grasson Walter | $5,000 | -- |
Source: Public Records
Mortgage History
| Date | Status | Borrower | Loan Amount |
|---|---|---|---|
| Open | Trepal John E | $119,800 | |
| Closed | Trepal John E | $119,900 |
Source: Public Records
Tax History Compared to Growth
Tax History
| Year | Tax Paid | Tax Assessment Tax Assessment Total Assessment is a certain percentage of the fair market value that is determined by local assessors to be the total taxable value of land and additions on the property. | Land | Improvement |
|---|---|---|---|---|
| 2024 | $4,318 | $61,530 | $20,720 | $40,810 |
| 2023 | $5,614 | $63,010 | $16,560 | $46,450 |
| 2022 | $5,394 | $63,000 | $16,560 | $46,450 |
| 2021 | $5,348 | $63,000 | $16,560 | $46,450 |
| 2020 | $5,012 | $51,660 | $13,580 | $38,080 |
| 2019 | $4,519 | $147,600 | $38,800 | $108,800 |
| 2018 | $4,359 | $51,660 | $13,580 | $38,080 |
| 2017 | $4,257 | $44,840 | $12,710 | $32,130 |
| 2016 | $4,223 | $44,840 | $12,710 | $32,130 |
| 2015 | $4,275 | $44,840 | $12,710 | $32,130 |
| 2014 | $4,275 | $45,750 | $12,950 | $32,800 |
Source: Public Records
Map
Nearby Homes
- 1842 Aldersgate Dr
- 1775 Brainard Rd
- 1857 Brainard Rd
- 5688 Shawnee Dr
- 1856 Bremerton Rd
- 250 Eagle Point Dr
- 1922 Winchester Rd
- 1839 Caronia Dr
- 5560 Lansbury Ln
- 1763 Temple Ave
- 1652 Temple Ave
- 1722 Hawthorne Dr
- 1443 Churchill Rd
- 1590 Longwood Dr
- 5204 Haverford Dr
- 5831 Alberta Dr
- 1403 Churchill Rd
- 1574 Hawthorne Dr
- 2112 Acacia Park Dr Unit 319
- 2112 Acacia Park Dr Unit 214
- 1731 Sunview Rd
- 1747 Sunview Rd
- 1725 Sunview Rd
- 1755 Sunview Rd
- 1723 Sunview Rd
- 1759 Sunview Rd
- 1732 Sunview Rd
- 1738 Sunview Rd
- 1744 Sunview Rd
- 1728 Sunview Rd
- 1748 Sunview Rd
- 1711 Sunview Rd
- 1754 Sunview Rd
- 1720 Sunview Rd
- 1760 Sunview Rd
- 1771 Sunview Rd
- 1716 Sunview Rd
- 1764 Sunview Rd
- 1703 Sunview Rd
- 1712 Sunview Rd