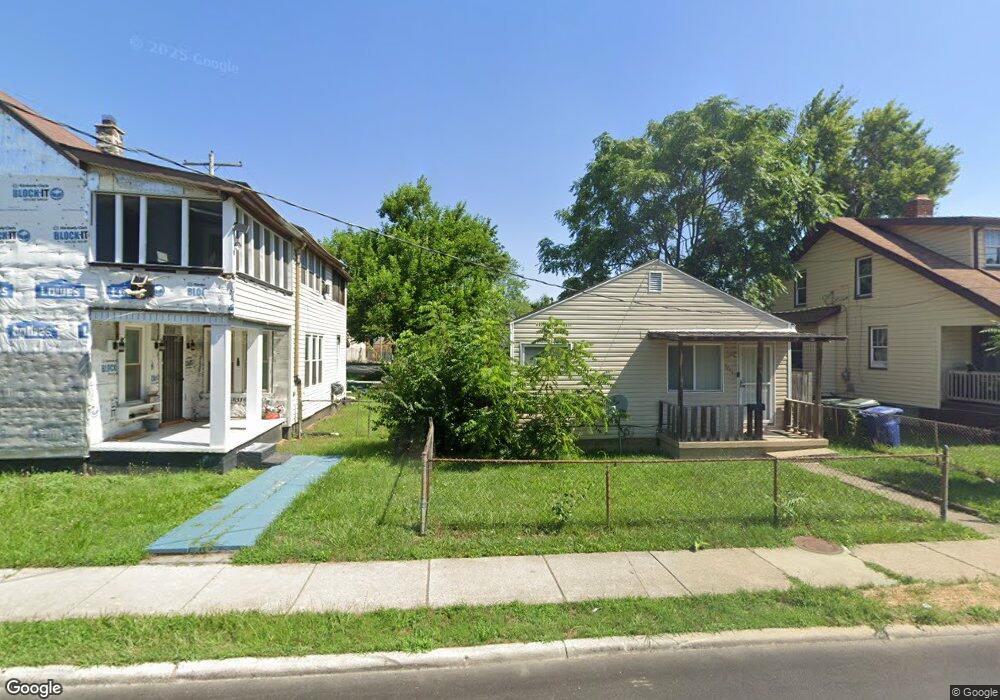
1738 Genessee Ave Unit 740 Columbus, OH 43211
North Linden NeighborhoodEstimated Value: $175,358 - $193,000
3
Beds
2
Baths
1,572
Sq Ft
$116/Sq Ft
Est. Value
About This Home
This home is located at 1738 Genessee Ave Unit 740, Columbus, OH 43211 and is currently estimated at $181,840, approximately $115 per square foot. 1738 Genessee Ave Unit 740 is a home located in Franklin County with nearby schools including Linden STEM Academy (K-6), Linden-Mckinley Stem School On Arcadia, and Focus Learning Academy of Central Columbus.
Ownership History
Date
Name
Owned For
Owner Type
Purchase Details
Closed on
Aug 9, 2018
Sold by
Asb Property Group Llc
Bought by
Davenport Harold and Davenport Lorraine
Current Estimated Value
Purchase Details
Closed on
Jun 23, 2015
Sold by
Baldwin Holloway Property Group Llc
Bought by
Asb Property Group Llc
Purchase Details
Closed on
Jul 17, 2014
Sold by
B & G Enterprise One Llc
Bought by
Baldwin Holloway Property Group Llc
Purchase Details
Closed on
Nov 5, 2010
Sold by
Gillispie Nancy and Gillispie Steve
Bought by
B & G Enterprises One Llc
Purchase Details
Closed on
Sep 24, 1996
Sold by
Est Nancy Rhoads
Bought by
Harris Nancy Joan
Create a Home Valuation Report for This Property
The Home Valuation Report is an in-depth analysis detailing your home's value as well as a comparison with similar homes in the area
Home Values in the Area
Average Home Value in this Area
Purchase History
| Date | Buyer | Sale Price | Title Company |
|---|---|---|---|
| Davenport Harold | $51,000 | Pm Title Box | |
| Asb Property Group Llc | -- | None Available | |
| Baldwin Holloway Property Group Llc | $12,000 | None Available | |
| B & G Enterprises One Llc | $6,000 | Elite | |
| Harris Nancy Joan | $16,000 | -- |
Source: Public Records
Tax History Compared to Growth
Tax History
| Year | Tax Paid | Tax Assessment Tax Assessment Total Assessment is a certain percentage of the fair market value that is determined by local assessors to be the total taxable value of land and additions on the property. | Land | Improvement |
|---|---|---|---|---|
| 2024 | $3,838 | $40,360 | $10,330 | $30,030 |
| 2023 | $1,827 | $40,355 | $10,325 | $30,030 |
| 2022 | $1,092 | $20,550 | $3,750 | $16,800 |
| 2021 | $1,094 | $20,550 | $3,750 | $16,800 |
| 2020 | $1,096 | $20,550 | $3,750 | $16,800 |
| 2019 | $1,111 | $17,860 | $3,260 | $14,600 |
| 2018 | $705 | $17,860 | $3,260 | $14,600 |
| 2017 | $771 | $17,860 | $3,260 | $14,600 |
| 2016 | $381 | $4,870 | $3,150 | $1,720 |
| 2015 | $301 | $4,870 | $3,150 | $1,720 |
| 2014 | $302 | $4,870 | $3,150 | $1,720 |
| 2013 | $509 | $16,625 | $3,710 | $12,915 |
Source: Public Records
Map
Nearby Homes
- 00 Minnesota Ave
- 01 Minnesota Ave
- 1326 Minnesota Ave
- 2444 Bancroft St
- 1609 Arlington Ave
- 1799 Harold Place
- 1615 Minnesota Ave
- 1669 Manchester Ave
- 1576 Arlington Ave Unit 578
- 1614 Republic Ave
- 1566 Briarwood Ave
- 1691 E Weber Rd
- 1546 Myrtle Ave
- 1938 Myrtle Ave
- 1544 Briarwood Ave
- 1535 Arlington Ave
- 1547 Minnesota Ave
- 1985 Aberdeen Ave
- 1967 Denune Ave
- 1995 Minnesota Ave
- 1738-1740 Genessee Ave Unit 740
- 1744 Genessee Ave
- 1748 Genessee Ave
- 1752 Genessee Ave
- 2552 Cleveland Ave
- 2556 Cleveland Ave
- 2558-2560 Cleveland Ave
- 2558 Cleveland Ave Unit 560
- 2548 Cleveland Ave
- 2546 Cleveland Ave
- 1758 Genessee Ave
- 2552 Cleveland Ave
- 1737 Genessee Ave
- 1745 Genessee Ave
- 1745 Genessee Ave Unit 747
- 1772 Genessee Ave
- 2572 Cleveland Ave
- 1755 Genessee Ave
- 2535 Cleveland Ave
- 2514 Cleveland Ave