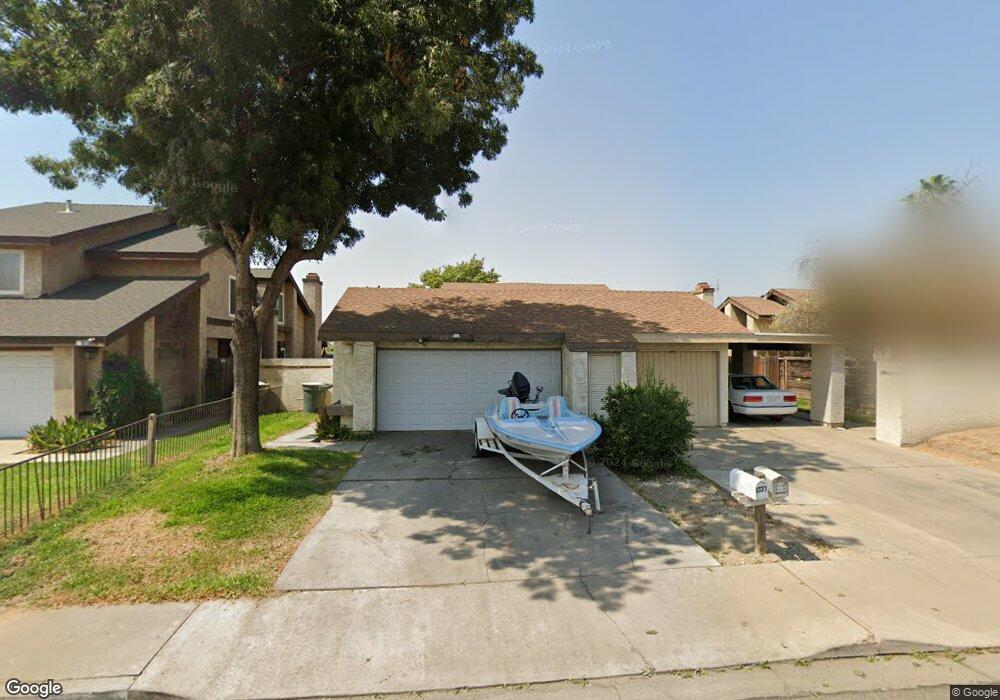
1739 N Tipton St Visalia, CA 93292
North Visalia NeighborhoodEstimated Value: $196,204 - $240,000
2
Beds
1
Bath
942
Sq Ft
$231/Sq Ft
Est. Value
About This Home
This home is located at 1739 N Tipton St, Visalia, CA 93292 and is currently estimated at $217,551, approximately $230 per square foot. 1739 N Tipton St is a home located in Tulare County with nearby schools including Four Creeks Elementary School, Valley Oak Middle School, and Golden West High School.
Ownership History
Date
Name
Owned For
Owner Type
Purchase Details
Closed on
Nov 30, 2017
Sold by
Marroquin Angel C and Bojorquez Martha Luz Flores
Bought by
Flores Bojorquez Martha Luz
Current Estimated Value
Purchase Details
Closed on
Jan 4, 2011
Sold by
Homesales Inc
Bought by
Marroquin Angel C and Marroquin Martha
Purchase Details
Closed on
Aug 24, 2010
Sold by
Hernandez Ana Berta
Bought by
Homesales Inc
Purchase Details
Closed on
May 24, 2001
Sold by
Washington Mutual Bank Fa
Bought by
Grajeda Ismael and Hernandez Berta
Home Financials for this Owner
Home Financials are based on the most recent Mortgage that was taken out on this home.
Original Mortgage
$29,707
Interest Rate
7.15%
Purchase Details
Closed on
Dec 18, 2000
Sold by
Gould Thomas G
Bought by
Washington Mutual Bank Fa
Purchase Details
Closed on
Apr 25, 1994
Sold by
Gould Thomas George
Bought by
Gould Thomas G
Home Financials for this Owner
Home Financials are based on the most recent Mortgage that was taken out on this home.
Original Mortgage
$46,125
Interest Rate
7.79%
Create a Home Valuation Report for This Property
The Home Valuation Report is an in-depth analysis detailing your home's value as well as a comparison with similar homes in the area
Home Values in the Area
Average Home Value in this Area
Purchase History
| Date | Buyer | Sale Price | Title Company |
|---|---|---|---|
| Flores Bojorquez Martha Luz | -- | None Available | |
| Marroquin Angel C | $35,000 | None Available | |
| Homesales Inc | $50,297 | Accommodation | |
| Grajeda Ismael | $33,000 | First American Title Co | |
| Washington Mutual Bank Fa | $45,000 | Cuesta Title Company | |
| Gould Thomas G | -- | -- |
Source: Public Records
Mortgage History
| Date | Status | Borrower | Loan Amount |
|---|---|---|---|
| Previous Owner | Grajeda Ismael | $29,707 | |
| Previous Owner | Gould Thomas G | $46,125 |
Source: Public Records
Tax History Compared to Growth
Tax History
| Year | Tax Paid | Tax Assessment Tax Assessment Total Assessment is a certain percentage of the fair market value that is determined by local assessors to be the total taxable value of land and additions on the property. | Land | Improvement |
|---|---|---|---|---|
| 2025 | $481 | $44,837 | $12,811 | $32,026 |
| 2024 | $481 | $43,959 | $12,560 | $31,399 |
| 2023 | $468 | $43,098 | $12,314 | $30,784 |
| 2022 | $447 | $42,254 | $12,073 | $30,181 |
| 2021 | $448 | $41,425 | $11,836 | $29,589 |
| 2020 | $437 | $41,001 | $11,715 | $29,286 |
| 2019 | $432 | $40,197 | $11,485 | $28,712 |
| 2018 | $413 | $39,409 | $11,260 | $28,149 |
| 2017 | $417 | $38,636 | $11,039 | $27,597 |
| 2016 | $401 | $37,879 | $10,823 | $27,056 |
| 2015 | $390 | $37,310 | $10,660 | $26,650 |
| 2014 | $390 | $36,579 | $10,451 | $26,128 |
Source: Public Records
Map
Nearby Homes
- 1633 N Tipton St
- 841 E Prospect Ave
- 625 E Ferguson Ave
- 339 NE 4th Ave
- 203 E Harold Ct
- 312 NE 4th Ave
- 636 E Roosevelt Ave
- 223 W Buena Vista Ave
- 1432 N Locust St
- 128 W Houston Ave
- 2218 N Oakhurst St
- 1145 E Ferguson Ave
- 1540 N Encina St
- 1146 E Buena Vista Ave
- 2241 N Edison St
- 1205 E Ferguson Ave
- 2420 N Michael St
- 2419 N Clark St
- 2435 N Clark St
- 2447 N Michael St
- 1745 N Tipton St
- 1737 N Tipton St
- 1747 N Tipton St
- 1729 N Tipton St
- 1727 N Tipton St
- 1809 N Tipton St
- 1809 N Tipton St
- 1811 N Tipton St
- 1719 N Tipton St
- 1736 N Tipton St
- 1748 N Tipton St
- 1717 N Tipton St
- 1819 N Tipton St
- 1819 N Tipton St
- 544 E Harold Ave
- 545 E Prospect Ave
- 1709 N Tipton St
- 1726 N Bridge St
- 548 E Harold Ave
- 547 E Prospect Ave